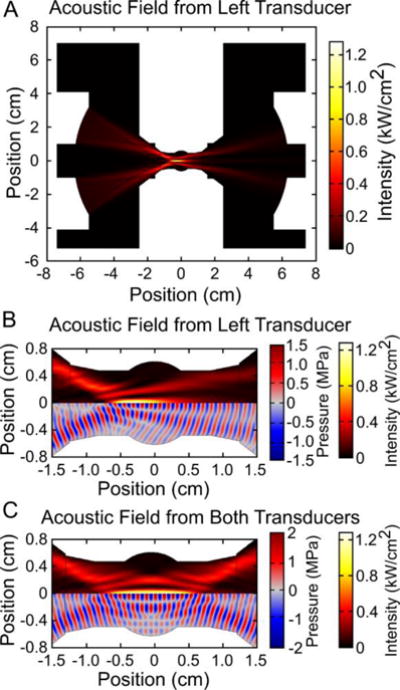
Figure 2.

The acoustic field was simulated to guide the design of the acoustic sample environment. A mid-plane section view of the acoustic field from the left transducer can be seen in panel (A) with the cropped view at the sample holder location shown in panel (B). Because the acoustic field is symmetric along the horizontal center line, plots in panels (B) and (C) are split to show the acoustic intensity (hot color scale) and the acoustic wave field (red/blue color scale). According to the simulations, acoustic focus is within 3 mm of the center of the sample holder. The average acoustic intensity field from the two transducers, shown in panel (C), uniformly covers an ellipsoidal region in the center of the sample holder.
