
Figure 3.
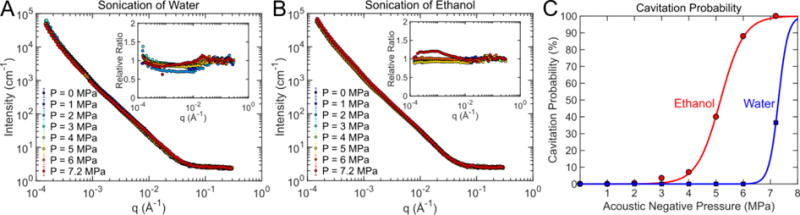
X-ray scattering profiles from (A) water and (B) ethanol showed little change with increasing acoustic pressure. The relative change in scattering intensity versus q is shown in the inset plots. (C) Cavitation was acoustically detected for both water and ethanol. The 50% cavitation threshold for water was 7.3 MPa and 5.1 MPa for ethanol. Although cavitation data suggested that cavitation was present at high acoustic pressures, it was not obvious in the 1-D scattering profiles.