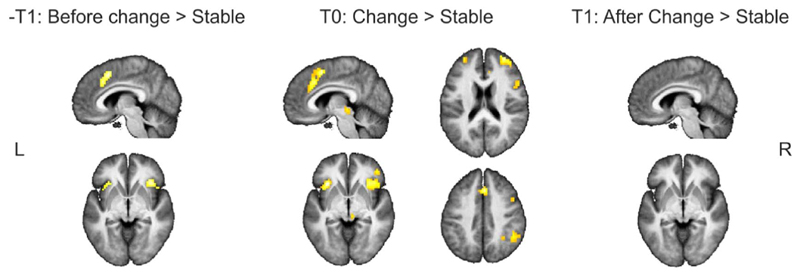
Fig. 3.
Whole-brain, random-effects group analyses for the gradual-naïve condition conducted with contrast t maps thresholded at an FWE = .05. Stable pictures (the first and last three pictures of each series) were contrasted with the picture before (− T1), at (T0) and after (T1) the change. Only clusters are reported with a cluster size of ten or more consecutive voxels.

