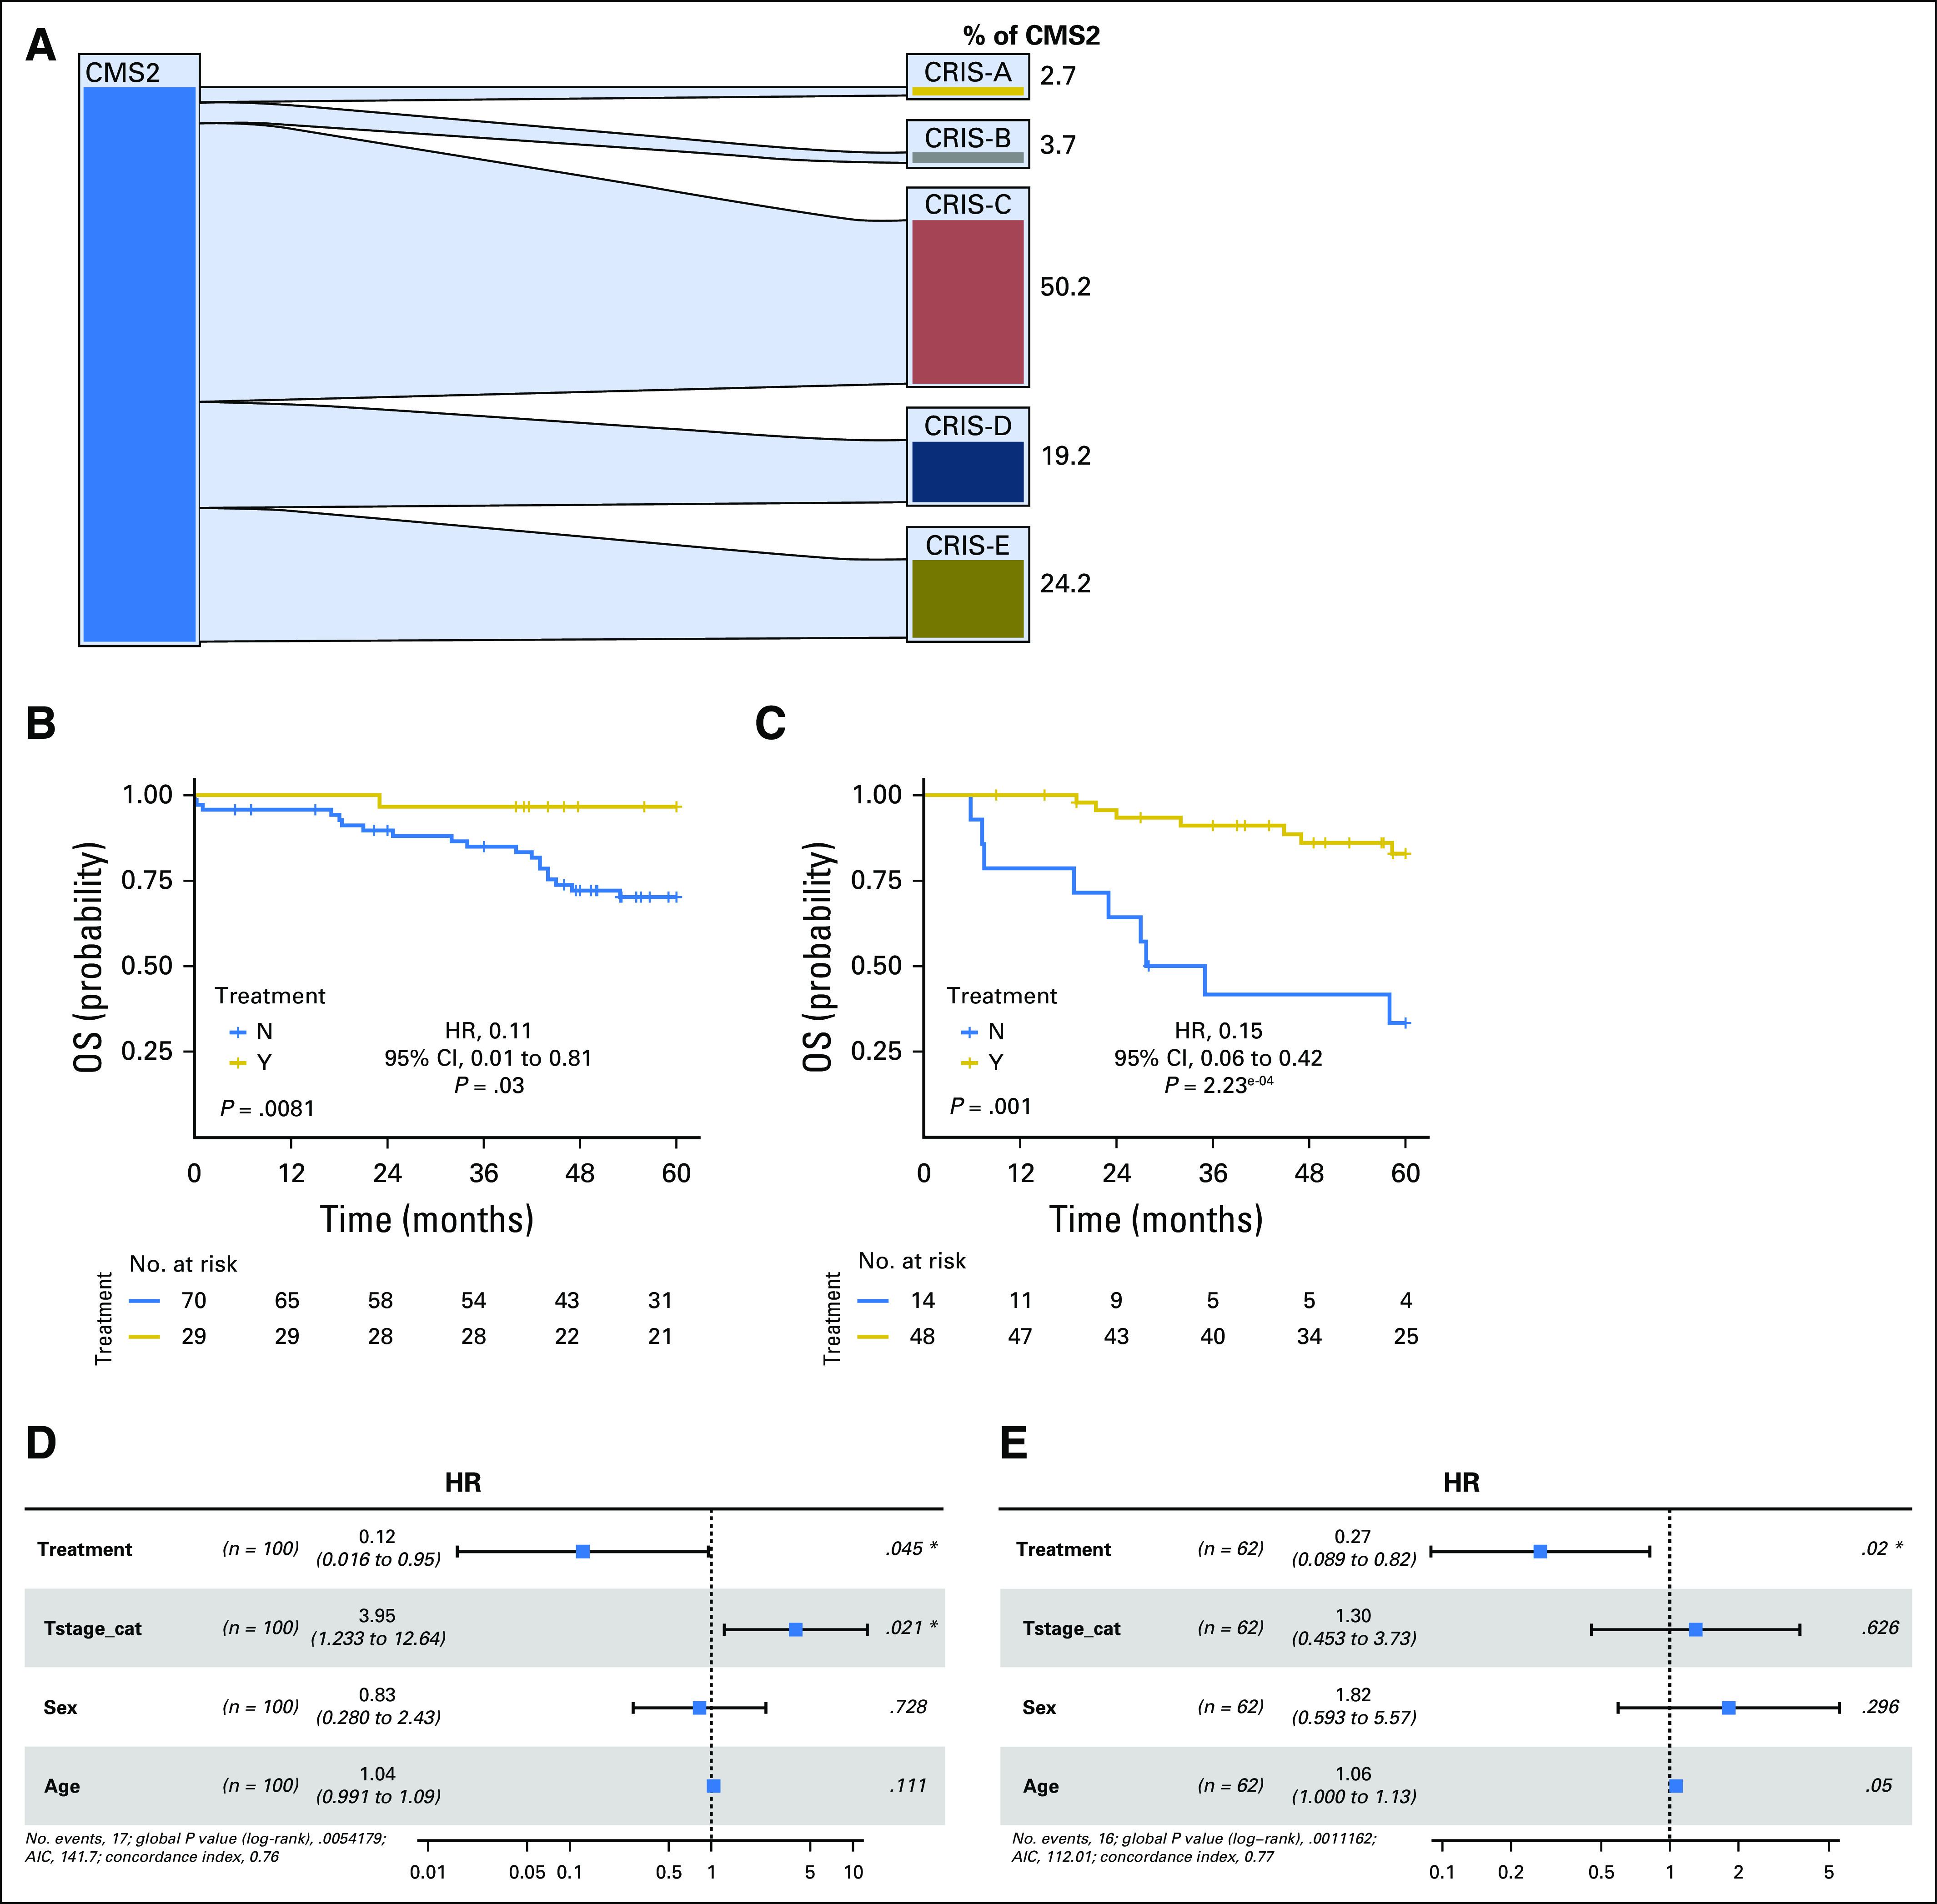
Fig 2.

(A) Caleydo plots display mapping of patient samples from the consensus molecular subtype 2 to the Colorectal Cancer Intrinsic Subtypes (CRIS) in the combined (taxonomy and GSE39582) data sets. Plots were generated using Caleydo 3.1.5 software (www.caleydo.org). (B and C) Kaplan-Meier plots of 5-year overall survival (OS) for the (B) stage II CRIS-C combined cohort and the (C) stage III CRIS-C combined cohort. (D and E) Forest plots show results from the adjusted Cox proportional hazards regression analysis for (D) stage II and (E) stage III CRIS-C in the combined cohort. Forest plots display the number of patients, hazard ratio (HR) for the chemotherapy-treated group with 95% CIs, and the Wald test of significance. The number of events and the log likelihood ratio is also presented. (*)Results defined as a significant hazard ratio in the Cox regression. AIC, Akaike's information criterion.
