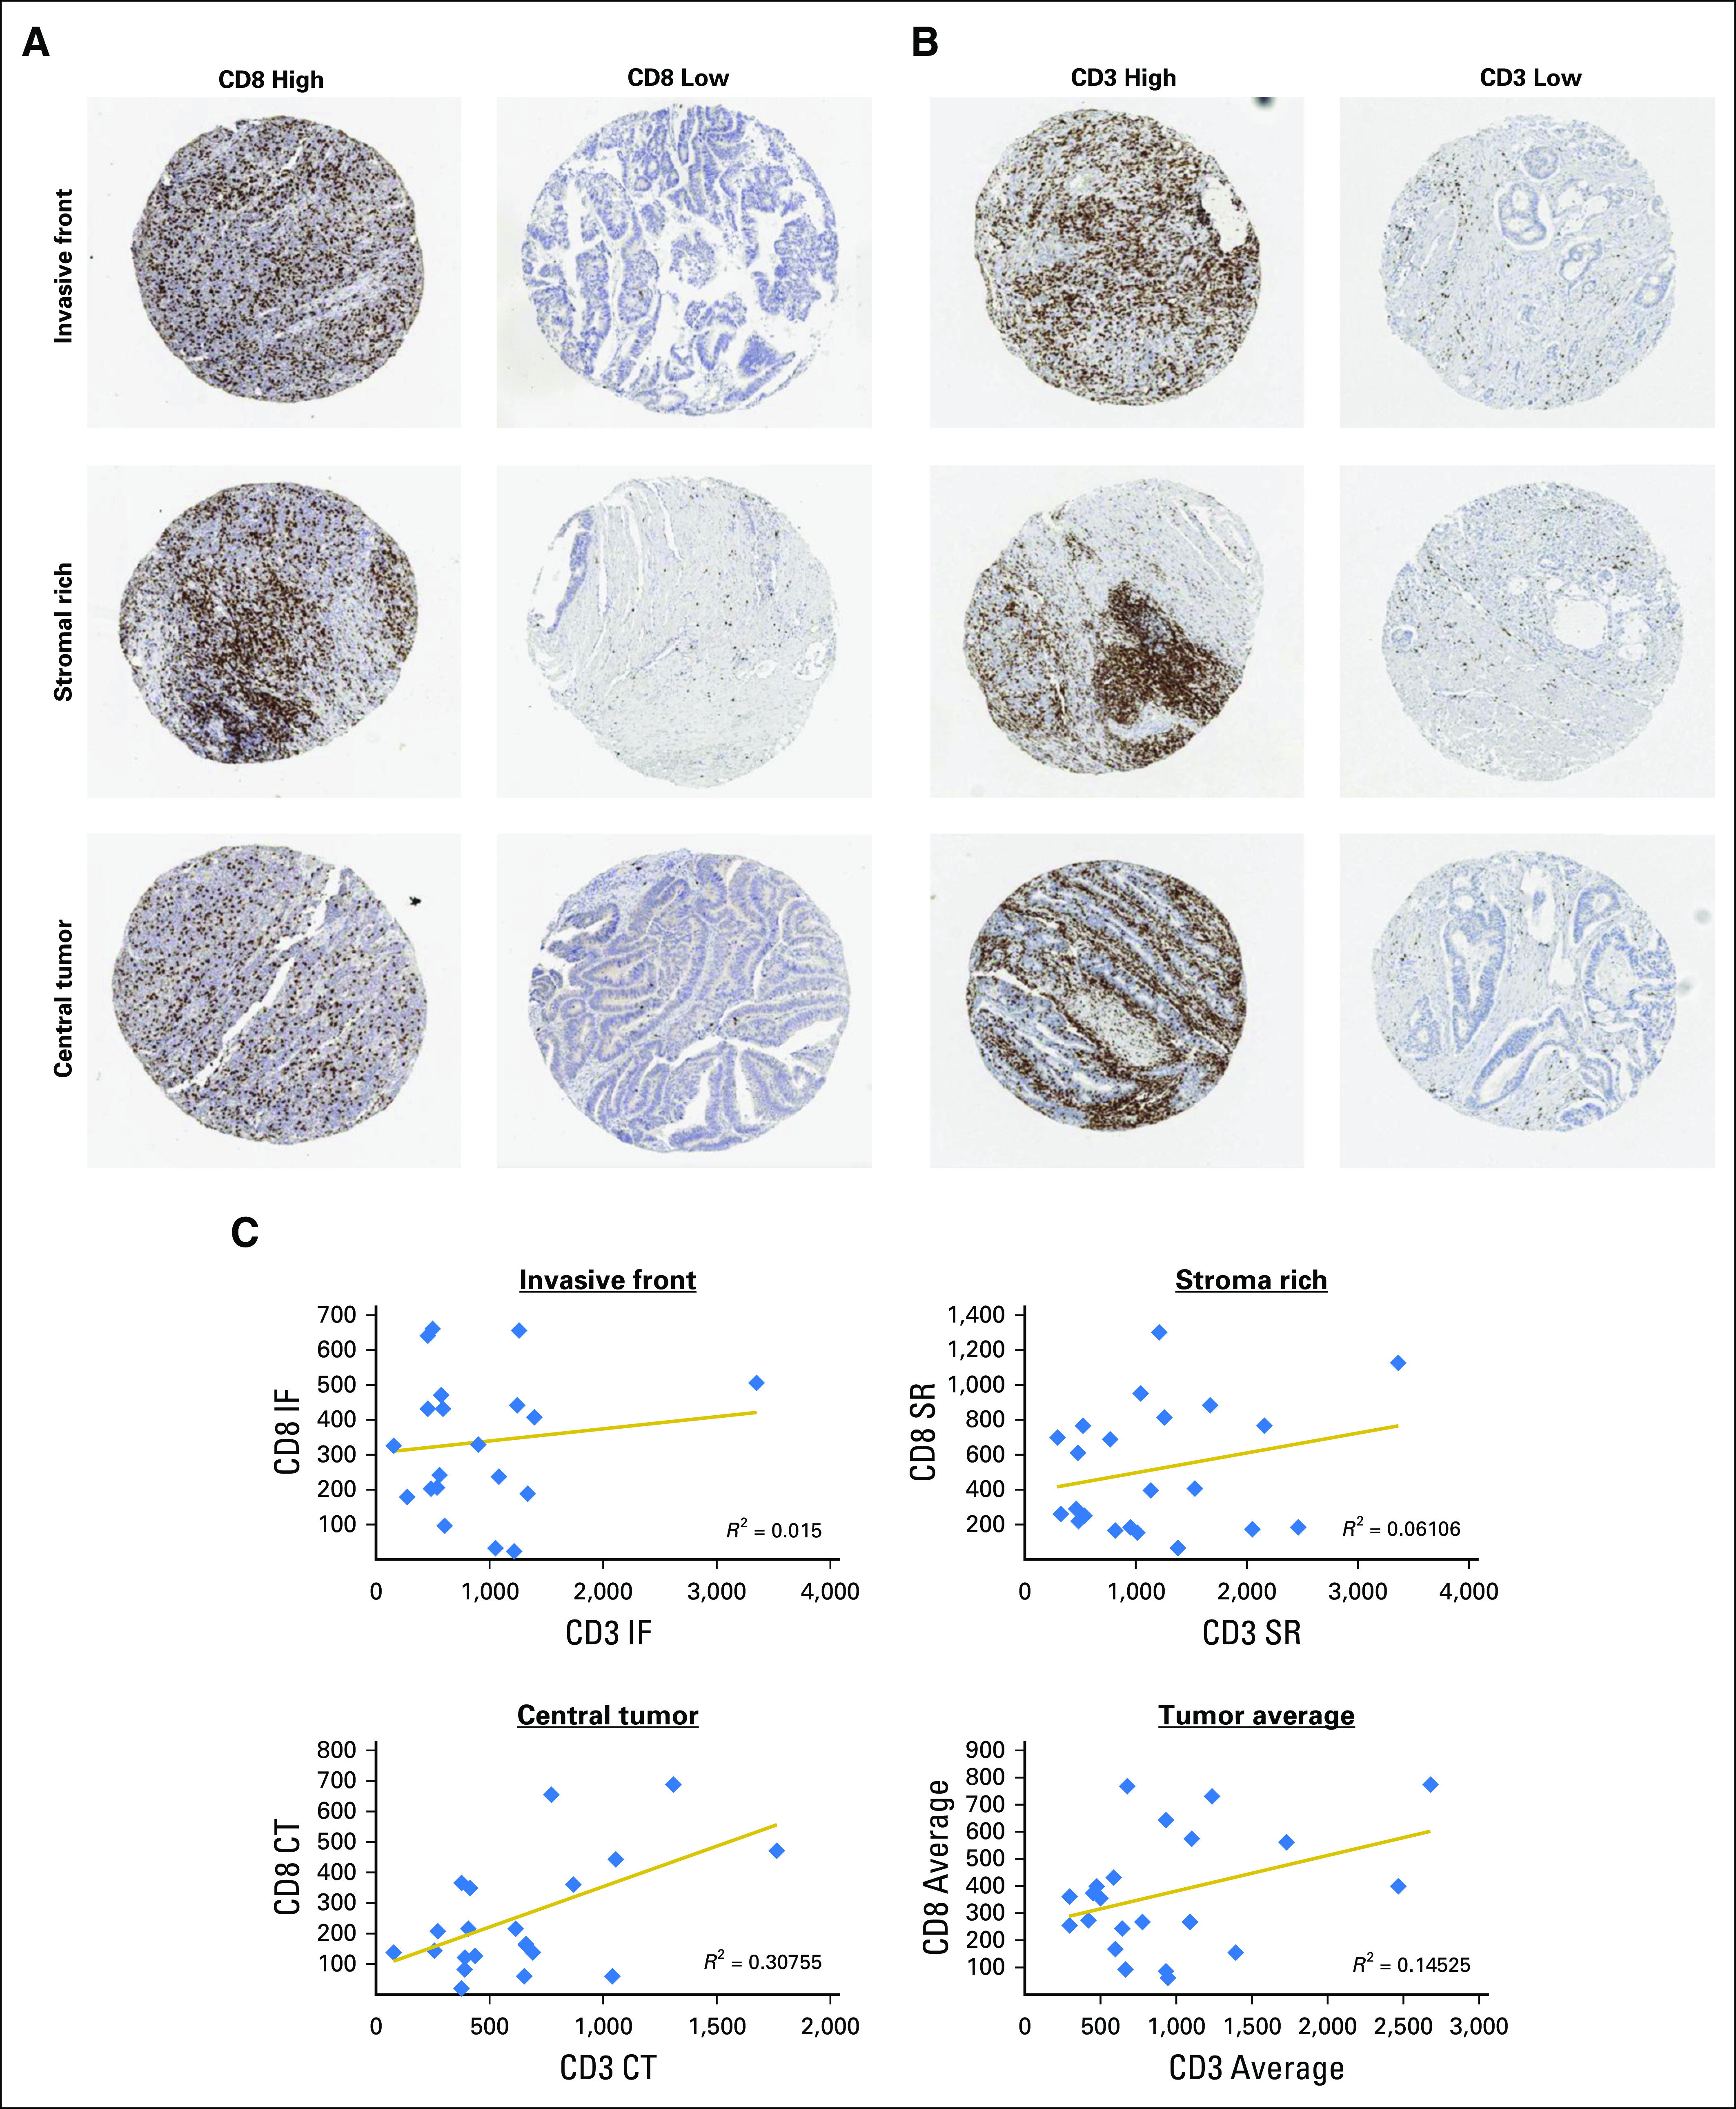
Fig 3.

(A and B) Representative images of samples display high and low (A) CD8 and (B) CD3 expression in each of the three tumor regions sampled: invasive front (IF), stromal rich (SR), and central tumor (CT). (C) Correlations between CD8 and CD3 at each of the three regions sampled: IF, SR, and CT, as well as the average expression. Displayed are the equations of the line and R2 value for the correlation.
