
Fig. 1. Selective optogenetic control of DG MCs.
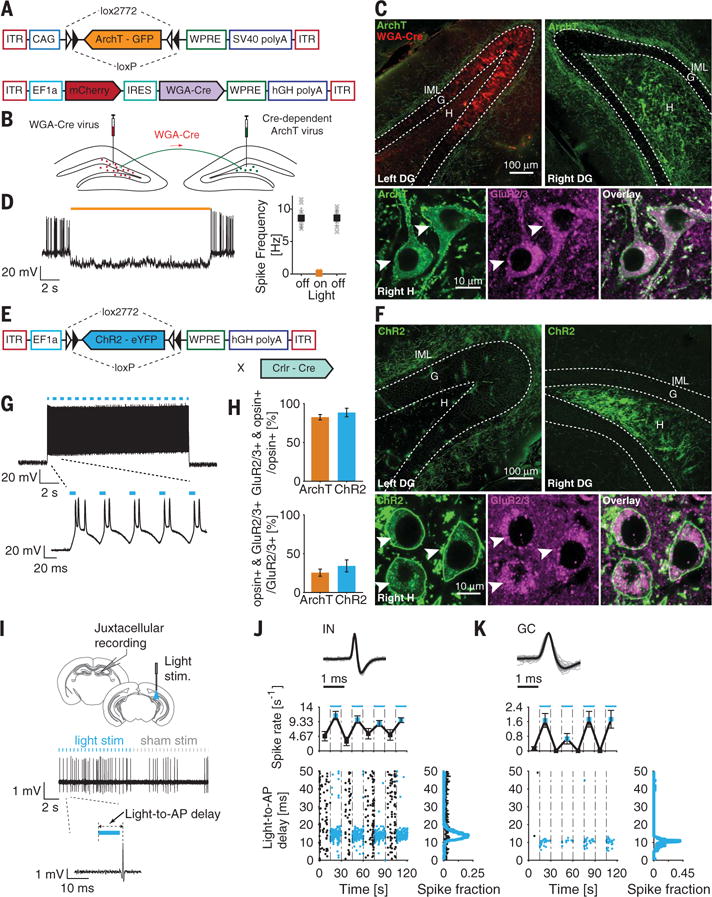
(A) ArchT expression system. (B) Topological targeting of MCs with a WGA-Cre fusion protein expressed in the left DG (red) that is transsynaptically and retrogradely trafficked by neurons with projections at the injection site. WGA-Cre activates ArchT expression in the right DG MCs (green). (C) (Top) Confocal images of WGA-Cre and ArchT expression. (Bottom) High-magnification images of the right hilus. ArchT-expressing MCs are identified via green fluorescent protein expression and GluR2/3+ immunostaining (arrowheads). (D) Illumination (15 s of 589-nm light) blocks current-induced spiking in ArchT-expressing MCs, quantified on the right (N = 10 recordings; n = 3 mice). (E) ChR2 expression system. (F) (Top) Confocal images of ChR2 expression. (Bottom) High-magnification images of the right hilus. ChR2-expressing MCs are identified via eYFP expression and GluR2/3+ immunostaining (arrowheads). (G) Illumination (473 nm, 15 s of a 20-Hz train of 10-ms pulses) induces ChR2-expressing MC firing (N = 5 recordings; n = 3 mice). (H) (Top) Opsin expression specificity (N = 103|24 slices; n = 3|5 mice for ArchT+|ChR2+). ArchT+ neurons were labeled using the WGA-Cre system, and ChR2+ neurons were labeled using the Crlr-Cre transgenic mouse system. (Bottom) Extent of opsin expression (N = 20|18 slices; n = 3|3 mice for ArchT+|ChR2+). (I to K) In vivo juxtacellular recordings of DG cells in MC ChR2-expressing mice. (I) (Top) Experimental schematic. (Bottom) Single-unit activity of an IN. [(J) and (K)] Neuronal activity of an IN (J) and a GC (K) in response to MC stimulation. (Top) Normalized spike (gray lines) and unit average (black line) waveforms. (Middle) Firing rate during alternating light-off (black) and light-on (blue) epochs. (Bottom) Scatter plot (left) and distribution plot (right) of the delay between the AP and the onset of the laser (blue) or sham pulse (black). All data are presented as mean ± SEM. G, granule cell layer; H, hilus; IML, inner molecular layer; AP, action potential.