
Fig. 2. Modulation of MC activity on electrographic seizure dynamics.
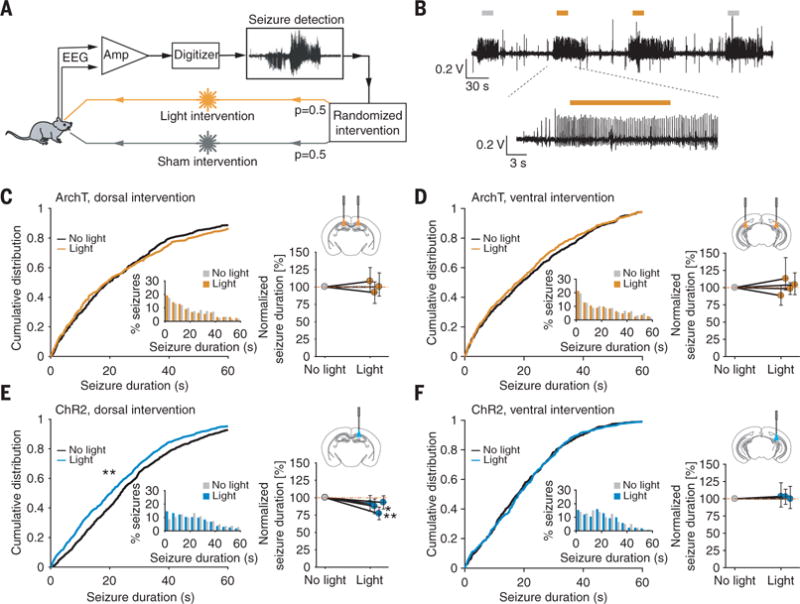
(A) Closed-loop approach for in vivo real-time detection and optogenetic intervention of spontaneous seizures in epileptic mice. (B) Electrographic seizures, where no light (gray bar) or light (orange bar) is delivered upon seizure detection. (C to F) Light delivery to the dorsal or ventral DG of ArchT-expressing mice [(C) and (D)] and to the dorsal or ventral DG of ChR2-expressing mice [(E) and (F)]. (Left) Cumulative distribution and probability density (inset) of the seizure duration after the start of light or no-light delivery (N = 917|1194|2161|903 seizures, n = 3|4|4|3 animals for ArchT dorsal|ArchT ventral|ChR2 dorsal| ChR2 ventral). (Right) Normalized difference in seizure duration ± 95% confidence interval (CI) (*P < 0.05; **P < 0.01; Mann-Whitney U test).