
Figure 3.
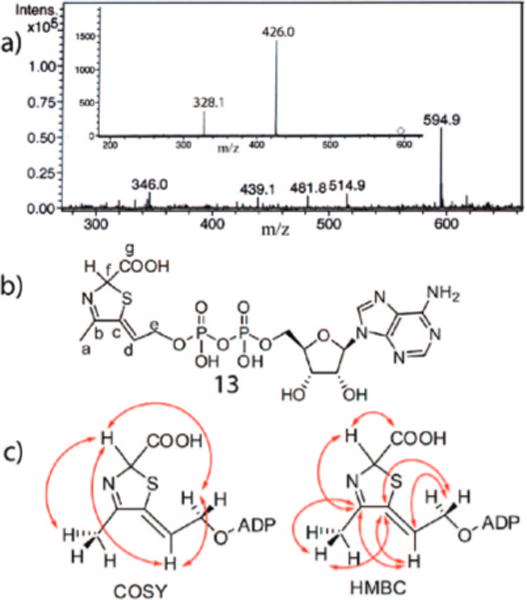
Spectroscopic analysis of the Peak B compound. (a) Negative mode ESI-MS analysis of the peak B compound. The inset shows the fragmentation pattern of the major species with m/z = 594.9. (b) Structure of the peak B compound deduced from NMR, MS and biochemical analyses. (c) Key COSY and HMBC correlations used to determine the structure the thiazole-tautomer.