
Figure 4. Tumor Necrosis Factor Receptor 1 (TNFR1) Expression in FLS.
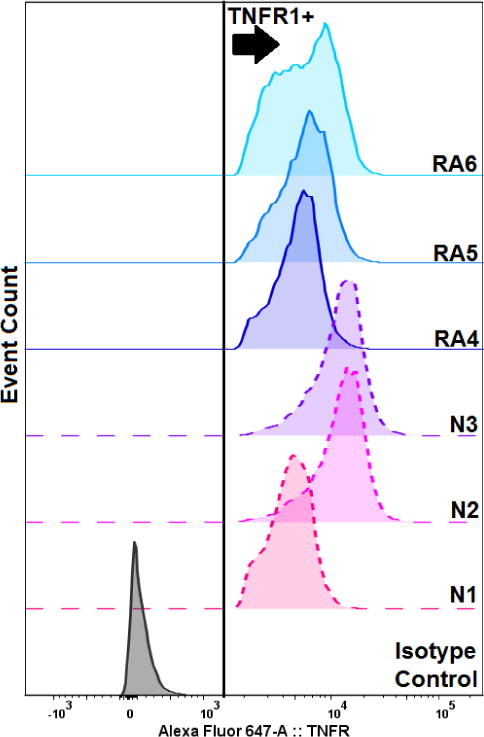
Normal subjects 1-3 (N1-N3, dashed lines) and RA subjects 4-6 (RA4-6, solid lines) FLS were co-stained with a monoclonal antibody to detect TNFR1 and the dead-cell indicator SYTOX Green (10 μM), then were analyzed by flow cytometry. Cells considered to be TNFR1 positive, viable cells are depicted to the right of the arrow.