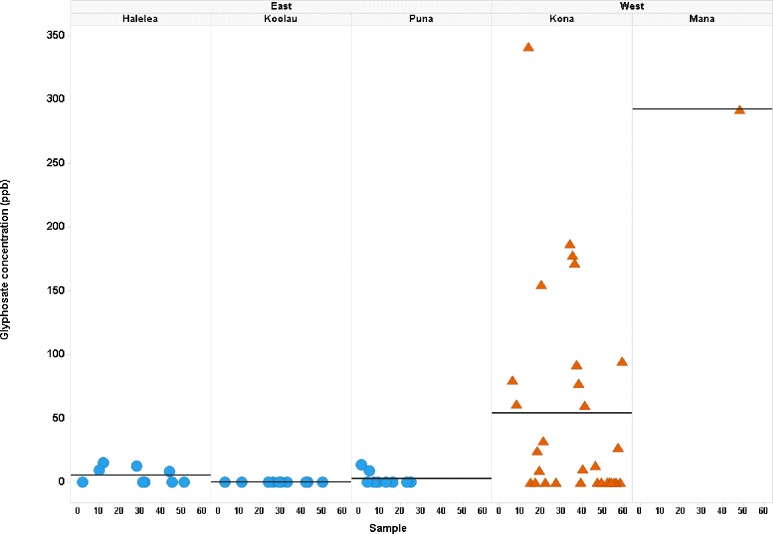
Fig 3. Glyphosate concentrations across samples by side of island and within each Moku.
Mean glyphosate (ppb) is shown by the horizontal line for each Moku. Side of the island and Moku names are listed at the top of the plot. Samples from the western Moku are shown as orange triangles and eastern Moku as blue circles.

