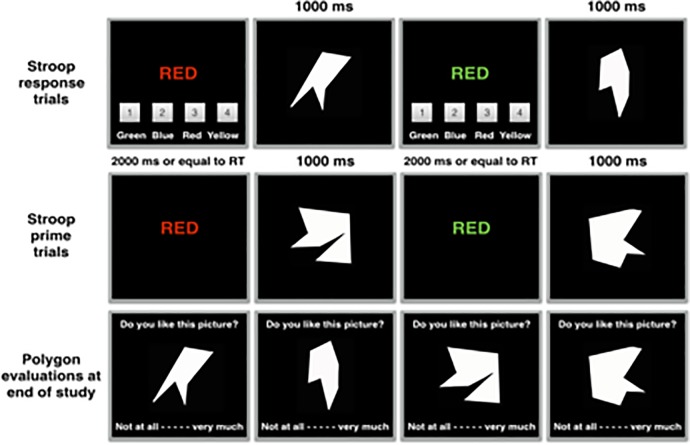
Fig 2. Experimental overview of studies 2B and 2C.
The upper row depicts two typical compatible and incompatible trials that require a response. The middle row depicts two typical compatible and incompatible trials that do not require a response. The row below depicts the evaluations at the end of the experiment.

