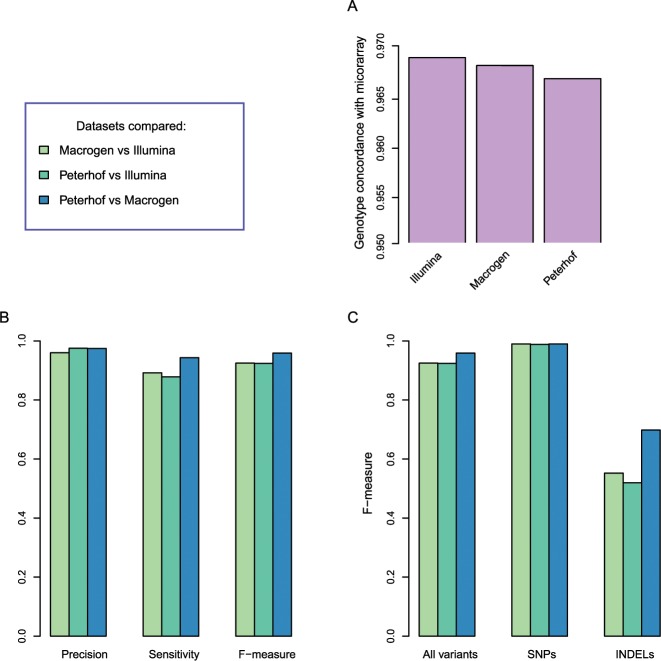
Fig 2. Genotype comparison.
(A) Concordance of WGS genotypes with microarray genotypes. The concordance was estimated based on the trio data as the ratio of microarray SNPs with identical genotypes in WGS results. (B) Comparison of the three WGS datasets between each other in terms of precision, sensitivity and F-measure for pairwise comparisons. Color legend is given on the top right. (C) Concordance of genotypes in the three WGS datasets for all variants, SNPs and indels. Color legend is given on the top right.

