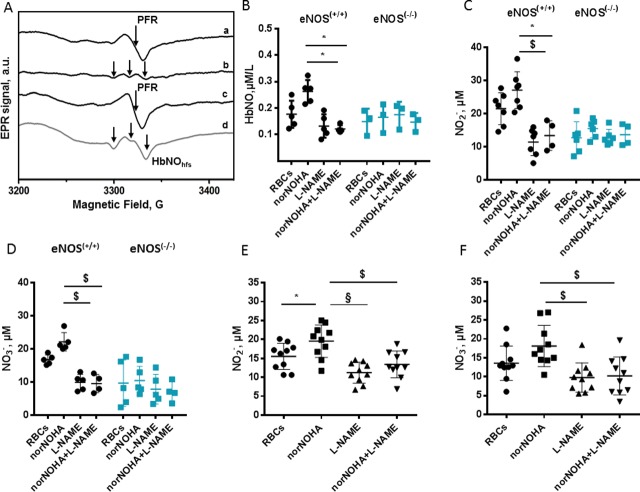
Fig 5. Detection of erythrocyte eNOS activity by EPR spectroscopy and by nitrite and nitrate colorimetric assay.
A. Typical procedure used for subtraction analysis: the EPR spectrum of RBC sample before (a) and after (b) subtraction of PFR EPR spectrum (c) obtained as described in Material and Methods. Typical HbNO EPR signal from immediately frozen mouse whole blood (d); the hyperfine structure (hfs) of HbNO is shown by the arrows. (B-F). Quantification of erythrocyte HbNO EPR signals (B) and products of NO oxidation, nitrite and nitrate formed in isolated RBCs of eNOS(+/+)and eNOS(-/-) mice (C and D) and in human erythrocytes (E and F), after incubation ex vivo with norNOHA and/or L-NAME as described in Materials and Methods. Data are shown as mean values ± SD; *P < 0.05, $P<0.01, § P < 0.0001; n = 3–7 different mouse RBC preparations and n = 10 different human preparations.

