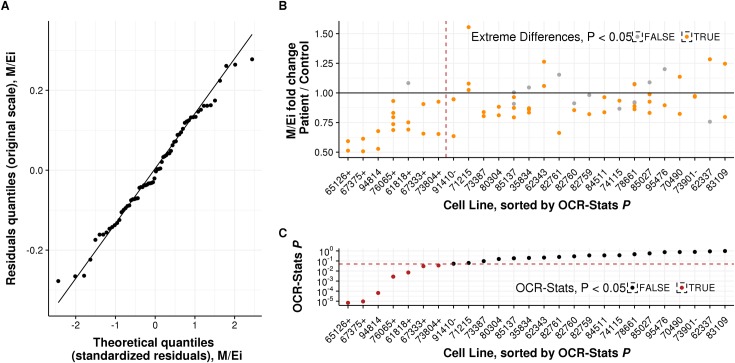
Fig 4. Statistical testing of M/Ei-fold change patient vs. control on multiple plates.
(A) Ratio of M/Ei-fold change (y-axis) of all the cell lines repeated across plates (x-axis) and their respective controls, sorted by the p-value obtained using the OCR-Stats method. Left of the red dashed line are cell lines with significantly lower M/Ei-fold change using OCR-Stats. Dots in orange represent biological samples with significantly lower or higher M/Ei-fold change using the ED method. Highlighted positive (+) and negative (–) controls. (B) Similar to (A), but depicting the p-value in logarithmic scale (y-axis) using OCR-Stats. Red dashed line at P = 0.05. Dots in red represent cell lines with significantly lower M/Ei-fold change using the OCR-Stats method. (C) Quantile-quantile theoretical (x-axis) vs. observed (y-axis) plot of the residuals ϵb,p of the linear model (2) applied to M/Ei-fold change. Points are lying on the diagonal as expected from normally distributed residuals.

