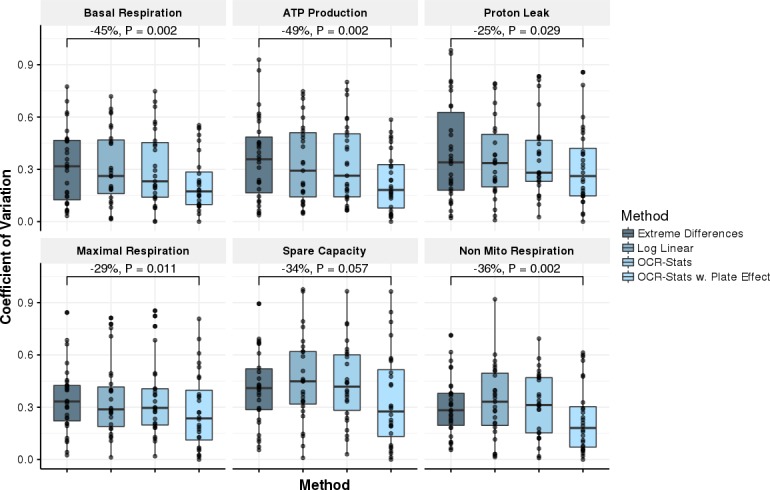
Fig 5. Benchmark using coefficient of variation.

Coefficient of variation (CV = standard deviation/mean, y-axis) of replicates across experiments (n = 26) using different methods (x-axis) to estimate the six bioenergetic measures. In all, except for Spare Capacity, OCR-Stats with plate-interval effect showed significantly lower variation with respect to the Extreme Differences method. P-values obtained from one-sided paired Wilcoxon test.
