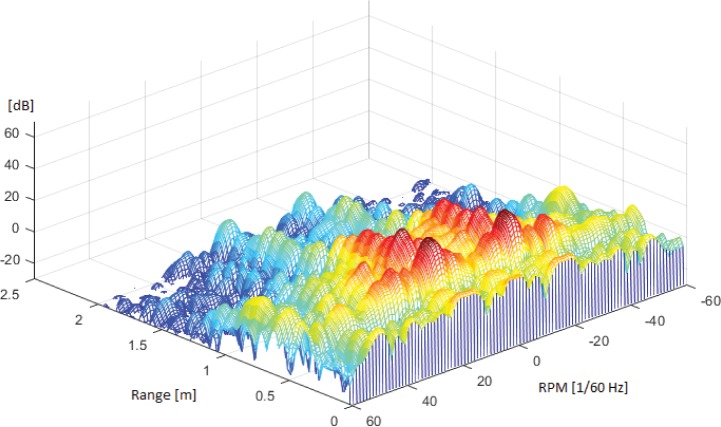
Figure 1. Breathing causes a characteristic pattern in the pulse-Doppler matrix, which is used to estimate the breathing frequency.
Plotted above is the strength, in decibels (dB) of frequency components (respirations per minute, RPM) received at different ranges, summarized over a period of 20 seconds. Symmetric peaks around the origin of the frequency axis indicate periodicity, as the inhalation and exhalation induces movements towards and away from the radar. The range to the first, highest, peaks gives the distance between the radar and the target. Weaker “mirror images” extend behind the first peaks as some portion of reflected waves take detours on their way back to the receiver (bouncing of walls, etc.)

