Abstract
Study Objectives:
Craniofacial abnormalities are a risk factor for obstructive sleep apnea (OSA). We have previously shown that phenotypic information derived from craniofacial photographs predict OSA in sleep clinic populations. However, there are likely ethnic and sex differences in craniofacial phenotypes related to OSA. We aimed to assess the use of craniofacial photography to identify interactions between OSA, ethnicity, and sex in craniofacial phenotype.
Methods:
Frontal and profile craniofacial photographs were analyzed from two sleep clinic populations of different ethnicity (Hong Kong Chinese, Australian Caucasians). OSA was defined as apnea-hypopnea index (AHI) > 10 events/h. Ten craniofacial measurements (three angles relating to jaw position and seven ratios describing proportions of the face) were examined for interactions between OSA status and sex or ethnicity) using factorial analysis of variance.
Results:
A total of 363 subjects (25% female) were included (n = 200 Chinese, n = 163 Caucasian), of which 33% were controls. There were two-way interactions for OSA with both sex (mandibular plane angle [F = 7.0, P = .009], face / eye width ratio [F = 4.7, P = .032], maxillary / mandibular volume ratio [F = 9.2, P = .003]) and ethnicity (face / nose width ratio [F = 4.0, P = .045], mandibular width / length ratio [F = 5.1, P = .024], maxillary / mandibular volume ratio [F = 11.0, P = .001]).
Conclusions:
We provide evidence of ethnic and sex differences in facial phenotype related to OSA. Furthermore, we demonstrate that craniofacial photography can be used as a phenotypic tool to assess these differences and allow investigation of OSA phenotypes in large samples. This has relevance to personalizing OSA recognition strategies across different populations.
Citation:
Sutherland K, Lee RW, Chan TO, Ng S, Hui DS, Cistulli PA. Craniofacial phenotyping in Chinese and Caucasian patients with sleep apnea: influence of ethnicity and sex. J Clin Sleep Med. 2018;14(7):1143–1151.
Keywords: craniofacial, ethnicity, facial phenotype, obstructive sleep apnea, photogrammetry, sex
BRIEF SUMMARY
Current Knowledge/Study Rationale: We have previously shown craniofacial photography to predict obstructive sleep apnea (OSA) risk in sleep clinic populations of different ethnicity. However, direct interethnic and sex comparisons of craniofacial risk factors in OSA are limited.
Study Impact: This study provides evidence that ethnicity and sex influence facial phenotypes associated with OSA risk and that craniofacial photography can be used as a tool to assess phenotypic differences in large samples.
INTRODUCTION
Obstructive sleep apnea (OSA) is a common sleep disorder that is increasing in prevalence1 in line with growing obesity rates. Obesity is a well-recognized risk factor for OSA along with male sex, age, and craniofacial structure.2 Craniofacial structure, such as skeletal abnormalities3 or enlarged upper airway soft tissues,4 may contribute to OSA by compromising pharyngeal airway space and increasing extraluminal collapsing pressures.5 Craniofacial differences in OSA have been reported using a variety of imaging modalities, most commonly lateral cephalometry, but also three-dimensional methods such as computed tomography (CT) and magnetic resonance imaging (MRI). Common observations in OSA, across ethnicity, are reduced craniofacial skeletal dimensions including smaller maxillomandibular dimensions, enlarged soft tissues such as the tongue and soft palate, and an inferiorly positioned hyoid bone.6,7
Although these imaging modalities are able to give insight into anatomical abnormalities that may lead to compromised upper airway function, they are labor intensive and expensive and hence restricted to the research setting. To address this, we have developed a simplified method for craniofacial phenotyping using photography.8 This methodology allows quantitative measurements of craniofacial dimensions computed from surface landmarks. We have previously applied this technique to patients attending a sleep laboratory and found that craniofacial photographic measurements differed between those with and without OSA.9 Additionally, craniofacial measures predicted the presence of OSA better than other recognized risk factors, particularly body mass index (BMI).9 Unlike more sophisticated imaging modalities, craniofacial phenotyping is a composite assessment of craniofacial skeletal and soft tissue components, such as regional obesity. Furthermore, we have previously shown that facial surface dimensions convey information about pharyngeal airway structures such as tongue volume.10,11 Therefore, craniofacial photography may capture a range of phenotypic information that relates to OSA risk and be useful in large-scale studies and OSA risk stratification.
There are likely ethnic and also sex differences in craniofacial phenotypes of OSA.12 We have previously identified craniofacial photographic measurements as predictive of OSA in both Chinese13 and predominantly Caucasian9 sleep clinic populations. The prediction models for OSA involved similar facial measurements and had similar predictive accuracy within each ethnic sample. However, a direct interethnic comparison of craniofacial photographic measurements between the two ethnic populations is warranted. Accordingly, the aim of this study was to assess the influence of ethnicity and sex on craniofacial phenotypes relating to OSA from two ethnically diverse sleep clinic samples using simple photographic phenotyping. We hypothesized that there would be differences in the craniofacial measurements relating to OSA between ethnic and sex groups.
METHODS
Clinical Samples
Data were collected from clinical patients referred to sleep laboratories at the Prince of Wales Hospital, Shantin, Hong Kong and Royal North Shore Hospital, Sydney, Australia. Analysis of craniofacial data of subjects from both sleep laboratories have been previously reported in individual publications.9,13 Briefly, the inclusion criteria in both studies were attendance for polysomnography at either center. Subjects were excluded only in the case of confounders of craniofacial analysis (eg, presence of syndromal craniofacial abnormalities, previous craniofacial surgery, or excessive facial hair). Because the purpose of this current analysis was to make interethnic comparisons, subjects were only included if they fit into one of two ethnic groups: Chinese or Caucasian. The Chinese group were all recruited from the Hong Kong Site. Subjects from the Sydney site were included if they reported Caucasian ethnicity (n = 162, 90% of original sample). As for previous analysis, OSA cases were defined as apnea-hypopnea index (AHI) ≥ 10 events/h and controls as AHI < 10 events/h.
Craniofacial Photography and Analysis
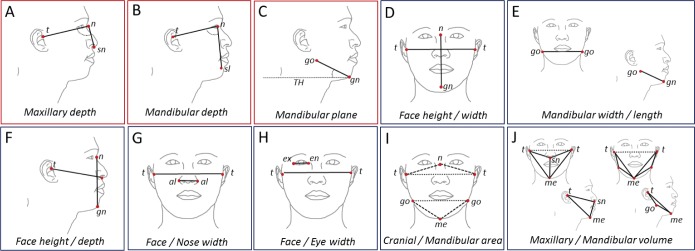
Craniofacial photography was performed as previously described.9,13 Briefly, a standardized front and profile photograph is taken of the face. The bony landmark gonion (lateral point on the angle of the mandible) was identified by palpation and marked before the photograph. Subjects were photographed in the natural head position with neutral facial expression and teeth and lips lightly touching. The craniofacial photographs with surface landmarks are illustrated in Figure 1. Photograph analysis was performed using image analysis software (Image J, versions 1.36 and 1.42q, National Institutes of Health, Bethesda, Maryland, United States) to obtain x and y coordinates of surface landmarks for computation of craniofacial dimensions. Measurements are either obtained from the front or profile photo or using a combination of both coordinates for three-dimensional areas and polyhedral volumes. For this analysis we wished to use craniofacial measurements, which do not require calibration to achieve absolute measurements, and therefore we selected craniofacial angles and ratios for analysis. These craniofacial measures are depicted in Figure 2.
Figure 1. Facial photographic technique.
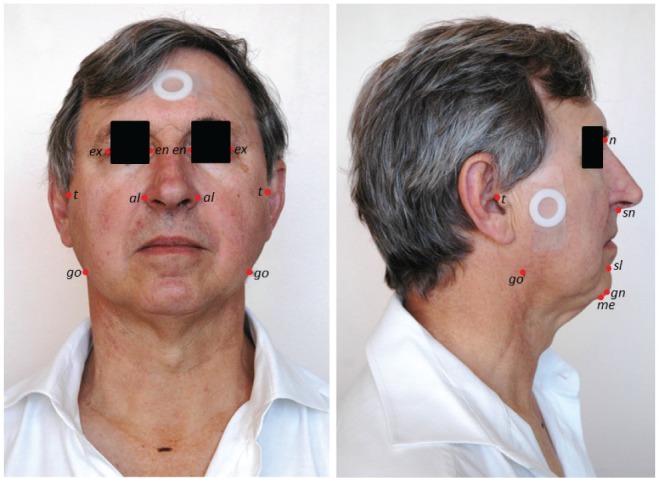
Front and profile photos are taken of the subject with a circular calibration marker placed on the face. The facial surface landmarks used to construct the measurements in this analysis are illustrated. Surface landmarks: al = alare, en = endocanthion, ex = exocanthion, gn = gnation, go = gonion, me = menton, n = nasion, sl = sublabiale, sn = subnasion, t = tragion The gonion landmark was marked on the skin surface with a skin-appropriate marker before the photograph to allow visualization.
Figure 2. Craniofacial angles and ratios.
Craniofacial measurements are derived using digitized facial surface landmarks. The craniofacial measurements used in this analysis are graphically illustrated. Angular measurements are shown in red boxes: (A) maxillary depth angle, (B) mandibular depth angle, (C) mandibular plane angle. Facial ratios are shown in blue boxes: (D) face height/width ratio, (E) mandibular width/length ratio, (F) face height/depth ratio, (G) face width/nose width ratio, (H) face width/eye width ratio, (I) cranial base area/mandibular area ratio, (J) maxillary volume/mandibular volume ratio. Surface landmarks: al = alare, en = endocanthion, ex = exocanthion, gn = gnation, go = gonion, me = menton, n = nasion, sl = sublabiale, sn = subnasion, t = tragion. TH = true horizontal line.
Polysomnography
Overnight in-laboratory polysomnography was scored by experience scorers at each site at previously described.9,13 The same scoring criteria were used at both sites; namely, hypopneas were defined as a ≥ 50% reduction in airflow for > 10 seconds in conjunction with a > 3% oxygen desaturation and/ or a cortical arousal.
Statistical Analysis
Statistical analysis was conducted using SPSS software (Version 21, IBM Corp, Armonk, New York, United States). Sample characteristics were compared between those with OSA and controls using independent samples t test for continuous variables or chi-square test for frequency variables. A three-way analysis of variance was used to examine the main effects and interactions of three independent variables (OSA status, sex, and ethnicity) on uncalibrated craniofacial variables. Models were adjusted for age, height, BMI, and neck circumference. Craniofacial data are presented as estimated marginal means (± standard error) adjusted for these potential confounders. Of particular interest were the two-way interactions between OSA and ethnicity, OSA and sex, and the three-way interaction of OSA, sex, and ethnicity on craniofacial variables. Significance was accepted as P < .05.
RESULTS
Sample Characteristics
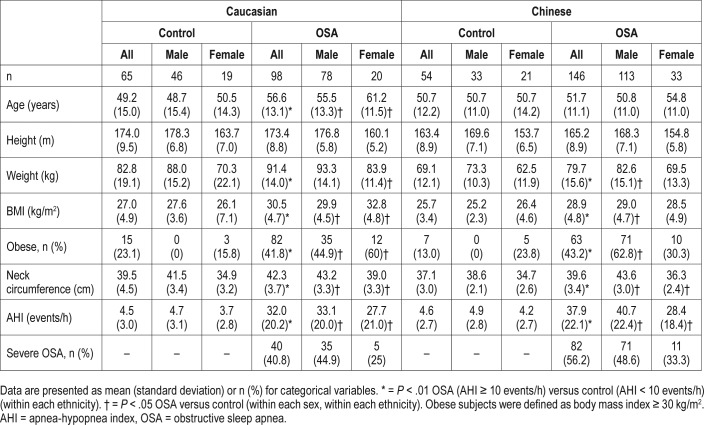
Clinical characteristics of the Chinese and Caucasian subjects are shown in Table 1. In both ethnic groups, patients with OSA were on average more obese than controls indicated by higher average BMI and neck circumference and the proportion of obese subjects (Table 1). Caucasian subjects with OSA were on average older than controls; however, there was no significant difference in age among Chinese subjects with and without OSA. These same differences in clinical characteristics between OSA and controls were observed within sexes for each ethnic group (Table 1). The Chinese patients with OSA were younger compared to Caucasian patients with OSA (mean difference ± standard error 4.9 ± 1.6 years, P = .003) and had a higher average AHI (mean difference ± standard error, 5.9 ± 2.7 events/h, P = .033) and a higher proportion of severe OSA (56.2% versus 40.8%, chi-square (df), 5.5(1), P = .09).
Table 1.
Sample characteristics.
Craniofacial Measures and OSA (Main Effects)
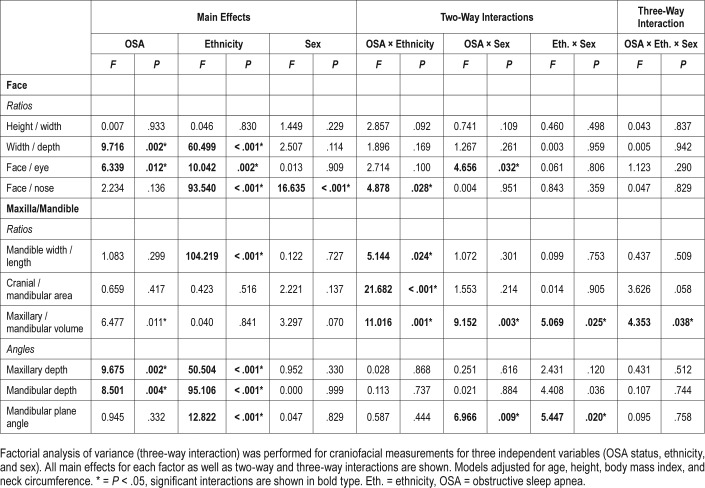
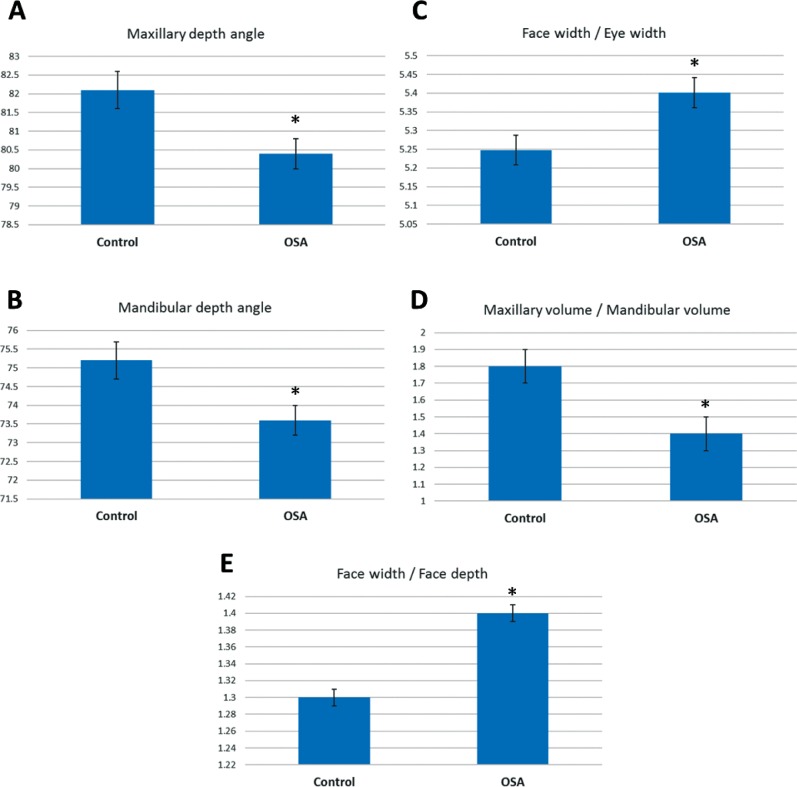
A three-way analysis of variance was conducted on the influence of three independent variables (OSA status, sex, ethnicity) on different measurements of craniofacial phenotype. Results of the main effects of each of the independent variables and all two- and three-way interactions are shown in Table 2. Mean values presented are estimated marginal means adjusted for covariates (age, height, BMI, neck circumference). There was a significant main effect for OSA on 5 (2 angles, 3 ratios) of the 10 craniofacial angles and ratios assessed. Maxillary depth angle (F1,350 = 9.7, P = .002) was decreased in those with OSA compared to controls (adjusted mean difference [95% CI] 1.8 [0.7, 2.9] degrees). Mandibular depth angle (F1,350 = 8.5, P = .004) was also decreased in those with OSA compared to controls (adjusted mean difference [95% CI] 1.6 [0.5, 2.8] degrees). The craniofacial ratios with a main effect for OSA were face width / depth (F1,350 = 9.7, P = .002), face width / eye width (F1,350 = 6.3, P = .012), and maxillary / mandibular volume (F1,350 = 6.5, P = .01). Face width / depth ratio was increased in OSA (adjusted mean difference [95% CI] 0.04 [0.02, 0.07]). Face / eye width ratio was increased in OSA (adjusted mean difference [95% CI] 0.01 (0.001, 0.001]). Maxillary volume /mandibular volume ratio was decreased in OSA (adjusted mean difference [95% CI] 0.3 (0.1, 0.7]). Craniofacial variables with significant main effects of OSA are displayed graphically in Figure 3.
Table 2.
Craniofacial characteristics in OSA by ethnicity and sex.
Figure 3. Craniofacial measurements in controls and subjects with OSA.
This figure illustrates differences for the main effect of OSA in the factorial analysis of variance (P < .05). The y axis represents the estimated marginal mean (mean value adjusted for other variables in the model, particularly height, body mass index, age, and neck circumference). There were five measurements that differed between controls and subjects with OSA, 2 craniofacial angles (A,B) and 3 craniofacial ratios (C,D,E). * = P < .05 controls versus subjects with OSA. OSA = obstructive sleep apnea.
Craniofacial Measures and OSA: Interactions With Ethnicity and Sex
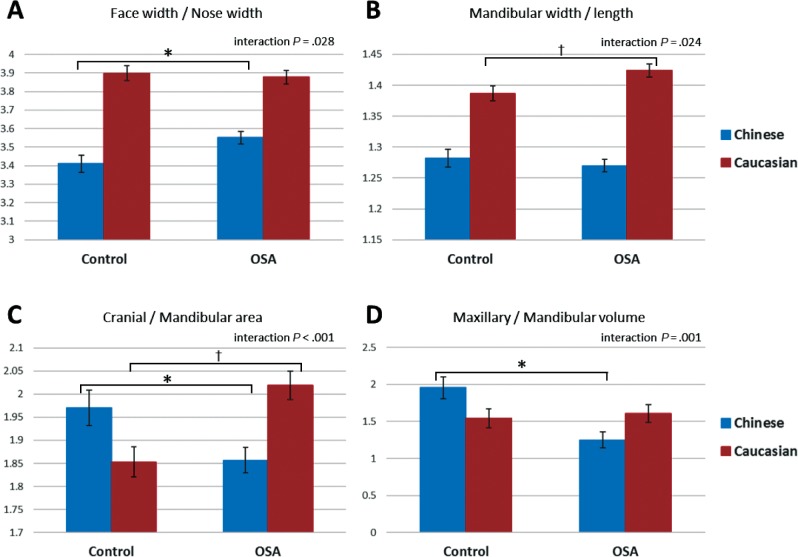
There were significant two-way interactions of OSA and ethnicity on four craniofacial phenotype measures (all ratios). These significant interactions are displayed graphically in Figure 4. There was a two-way interaction effect of OSA and ethnicity on the ratio of face width to nose width (F1,351 = 4.0, P = .045). An increase in this ratio in OSA is seen only in Chinese subjects (Figure 4A).
Figure 4. Craniofacial ratios and interaction between OSA status and ethnicity.
This figure illustrates craniofacial ratios for which there was a significant two-way interaction between OSA status and ethnicity in factorial analysis of variance (interaction P < .05). The y axis represents the estimated marginal mean (mean value adjusted for other variables in the model, particularly height, body mass index, age, and neck circumference). Post hoc group comparisons * = P < .05 controls versus subjects with OSA, Chinese ethnicity, † = P < .05 controls versus subjects with OSA, Caucasian ethnicity. OSA = obstructive sleep apnea.
A two-way interaction of ethnicity and OSA was also observed for the ratio of mandibular width to mandibular length (F1,350 = 5.1, P = .024). In this case there was an increase in this ratio in OSA only in Caucasian subjects (Figure 4B).
An interaction of OSA and ethnic group was also seen for the ratios of cranial area to mandibular area (F1,350 = 21.7, P < .001). In this case the pattern of interaction showed opposite effects between ethnic groups for the relationship of this ratio with OSA. In the Chinese group this ratio decreased in OSA, whereas in Caucasians, OSA was associated with a larger cranial area relative to mandibular area. The ratio of maxillary volume to mandibular volume also showed a two-way interaction between OSA and ethnicity (F1,350 = 11.0, P = .001). In this case there was no relationship between this ratio and OSA in Caucasians (P = .657), but a smaller ratio was evident in Chinese patients with OSA.
There were also significant interactions of OSA and sex in three of the craniofacial ratios, which are displayed graphically in Figure 4. Maxillary volume to mandibular volume showed a differential association with OSA between sexes (F1,350 = 9.2, P = .003). This ratio did not differ between males with and without OSA but was significantly decreased (P = .005) in females with OSA compared to female controls (Figure 5A).
Figure 5. Craniofacial variables and interaction between OSA status and sex.
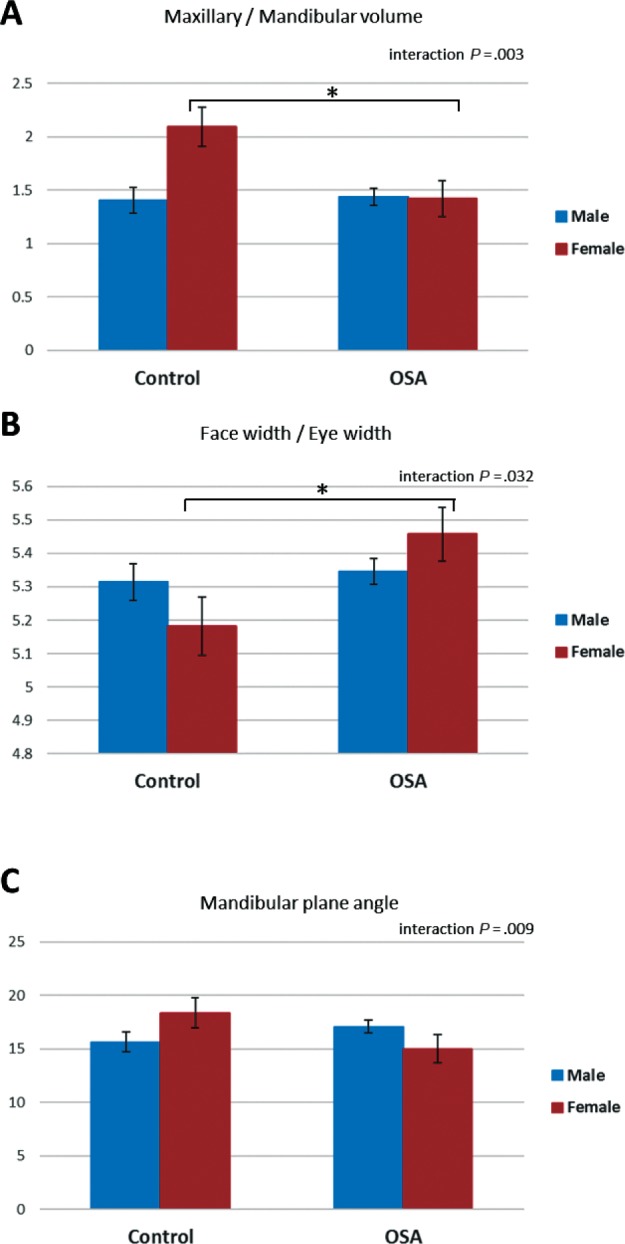
This figure illustrates craniofacial ratios for which there was a significant two-way interaction between OSA status and sex in factorial analysis of variance (P < .05). The y axis represents the estimated marginal mean (mean value adjusted for other variables in the model, particularly height, body mass index, age, and neck circumference). Post hoc group comparisons * = P < .05 controls versus subjects with OSA, female sex. OSA = obstructive sleep apnea.
Face width to eye width ratio also had a significant twoway interaction between OSA and sex (F1,351 = 4.7, P = .032). There was no association of this measure with OSA in males. However, there was a significant increase in females with OSA compared to controls (P = .001, Figure 5B). Finally, mandibular plane angle also showed an interaction of OSA and sex (F1,350 = 7.0, P = .009). In this case, mandibular plane angle was reduced in females with OSA compared to female controls (P < .001); however, in males with OSA there was a tendency for an increased mandibular plane angle relative to controls (P = .039).
There was a significant three-way interaction (F1,350 = 4.4, P = .038) with one craniofacial ratio, maxillary to mandibular volume (Figure 6). The pattern of interaction was that there was no difference between OSA and controls in this measure in either male or female Caucasians. There was an association with a smaller ratio in OSA in both male and female Chinese. However, there was a greater difference between controls and those with OSA in Chinese females, probably due to a higher ratio in female controls.
Figure 6. Three-way interaction of OSA status, ethnicity, and sex.
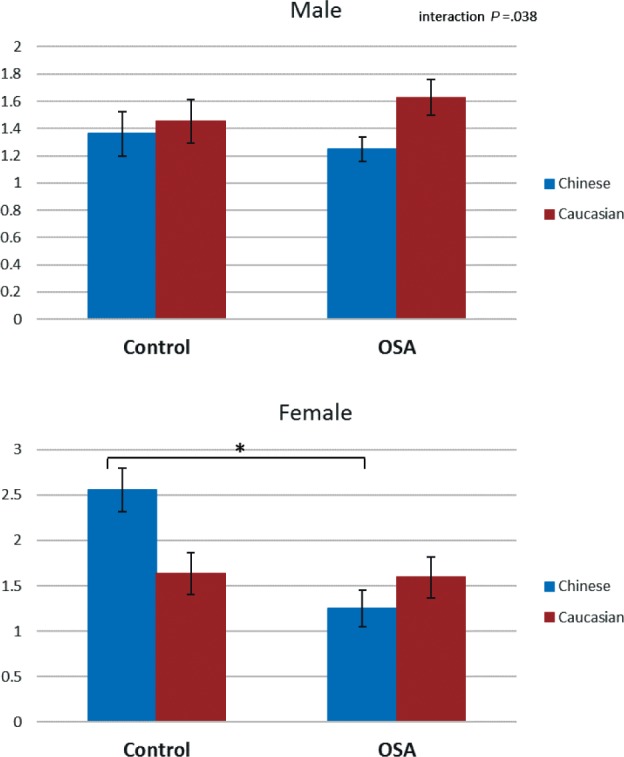
This figure illustrates the three-way interaction observed in the craniofacial ratio maxillary volume / mandibular volume in factorial analysis of variance (P < .05). The y axis represents the estimated marginal mean (mean value adjusted for other variables in the model, particularly height, body mass index, age, and neck circumference). Post hoc group comparisons * = P < .05 controls versus subjects with OSA. OSA = obstructive sleep apnea.
DISCUSSION
This study provides evidence that craniofacial phenotypes related to OSA, as measured by facial photography, are influenced by ethnicity and sex. Although there are published studies suggesting that ethnicity and sex may influence the craniofacial risk factors that relate to OSA, there have been relatively few direct interethnic comparisons and even fewer that consider sex differences. This is in part due to the complexity in assessing craniofacial structure in large cohorts and diverse samples. Although radiographic imaging can give detailed information about skeletal craniofacial structure, there are issues such as cost, time-consuming analyses, and standardization, not to mention radiation exposure. The photographic method for facial phenotyping used in this study was developed to provide a clinically applicable measure of craniofacial risk, which has been shown to relate to the presence of OSA in two different clinical populations.9,13 Facial phenotype captured by photography is not strictly a measure of underlying skeletal structure, but also captures regional adiposity and potentially also phenotypic information upper airway tissues.11 This study identifies interactions between sex and ethnicity in how craniofacial photographic variables relate to OSA.
The main aim of this study was to compare craniofacial measurements between OSA and controls with interaction terms for sex and ethnicity to determine whether OSA facial phenotypes vary with ethnicity and sex. We observed some interactions between both ethnic and sex groups with OSA, which suggest that craniofacial measures relate to OSA differently within these different groups. This study supports the use of facial photography to capture phenotypic differences of facial characteristics that relate to OSA by sex and ethnicity. There is limited previous evidence; however, the few studies that have made interethnic comparisons suggest that there are differences in craniofacial risk factors for OSA. For example, we have assessed lateral cephalograms of Chinese and Caucasian patients with OSA, and found that for the same degree of OSA severity, Chinese patients display relatively more skeletal restriction whereas Caucasian patients were more obese.14 This craniofacial restriction also suggested that obesity would have a stronger effect on AHI in the Chinese population.14 Cephalometry has also been used to assess Caucasian and African Americans with sleep-disordered breathing and controls. Caucasians showed skeletal characteristics associated with OSA, whereas this was not evident in African Americans for whom enlarged soft tissues were related to OSA.15 Other studies have identified craniofacial differences in OSA in Caucasians compared to Polynesians16 and Hispanics.17 Direct sex comparisons of craniofacial structures in OSA either within or between ethnicities are even less reported. A Thai study reported sex differences in cephalometric measurements that related to OSA.18 A study comparing Caucasians with OSA to community controls in terms of surface craniofacial measures found no interaction between sex and OSA status,19 suggesting craniofacial risk factors for OSA were the same for men and women.
Our previous work suggests craniofacial photography captures phenotypic information related to OSA. This two-dimensional photographic technique was designed to be simple to enable analysis in large samples. Through the use of a calibration marker (rigid nylon circle), absolute dimensions of the face are able to be obtained using the technique. For this study, we focused particularly on craniofacial variables that do not require calibration for several reasons. Not having to use a calibration marker makes this craniofacial assessment technique simpler to undertake. Although our previous work using facial photography suggests that there are differences in the linear dimensions of the face between those with OSA and controls, single measurements are unlikely to adequately capture craniofacial risk, especially because these are influenced by body size. Indeed, in our previous prediction models for OSA, a combination of four facial measures best classify patients as OSA or controls. In this study we have used ratios to assess the proportions of the face and which relative patterns of craniofacial may relate to OSA. Ratios such as cranial index and facial index have previously been used to describe craniofacial factors in OSA,20 and our analysis extends this novel approach.
In our analysis, we found main effects of a difference between those with OSA and controls (regardless of ethnic and sex group) between 3 craniofacial angles. Maxillary and mandibular depth angles (the photographic equivalent of SNA and SNB angles) were reduced in those with OSA. This is a common association with OSA found in cephalometric studies.3,21 There were no interaction effects with sex or ethnicity in the relationship with OSA, suggesting these may be common features of OSA in all groups. In terms of craniofacial ratios that differed between those with OSA and controls, patients with OSA had a relatively wider face compared with depth. A reduced eye width to face width ratio was also associated with OSA, which could suggest a relatively smaller total bony width of the face.
The limitation of craniofacial photography, as a composite assessment of craniofacial risk factors, means that we cannot definitively say whether the observed phenotypic differences reflect purely skeletal differences in craniofacial regions or also capture regional adiposity. However unique patterns of craniofacial phenotype appear to be found within Chinese and Caucasian patients with OSA. This study supports this photographic technique in more varied ethnic groups for assessment of craniofacial differences. Although craniofacial photography is not able to directly assess upper airway structures that could contribute to ethnic differences in OSA pathophysiology, nevertheless the simplicity of the technique allows craniofacial phenotypic information to be more readily collected in large numbers of subjects with comparisons across populations. However, a quantitative photographic technique to assess intraoral structures in OSA has recently been published.22
Limitations
This is the first direct interethnic study of craniofacial phenotyping by photography in OSA, and there are limitations to the study. First, all subjects were recruited from the sleep clinic and sleep clinic controls are likely to differ from those without apnea in the community. However, facial phenotyping as a tool for predicting the presence of OSA likely has use for triaging patients in primary or tertiary care. Additionally, we have used a cutoff of AHI 10 events/h to classify OSA in this clinical sample, to maximize numbers in the non-OSA group and therefore individuals in this group can have mild OSA or OSA symptoms. We analyzed 363 subjects in this study, which is large for a study of craniofacial phenotype and is testament to the feasibility of obtaining craniofacial data in large numbers using this technique. However, some of our subgroups for comparison, particularly the females, were very small. This reflects the usual demographics of sleep clinic populations. Therefore, there is a need to replicate these findings in larger samples. Also, we have only two ethnic groups and inclusion of more groups would be interesting in future studies. The simplicity of this photographic method and demonstration of application in detection of ethnic differences mean that this could be applied to other ethnic groups, including multiethnic populations.
CONCLUSIONS
Our study provides evidence that facial phenotype related to OSA varies with ethnicity and sex. The simple photographic technique used in this investigation could be applied to large samples in order to investigate OSA facial phenotype across multiple populations. This has relevance to personalizing OSA recognition strategies across different populations.
DISCLOSURE STATEMENT
All authors have seen and approved the manuscript. PAC holds an endowed Academic Chair position at the University of Sydney, funded by ResMed Inc. He has received research support from ResMed, SomnoMed, Zephyr Sleep Technologies He has a pecuniary interest in SomnoMed, resulting from previous involvement in research and development. All other authors report no conflicts of interest.
REFERENCES
- 1.Peppard PE, Young T, Barnet JH, Palta M, Hagen EW, Hla KM. Increased prevalence of sleep-disordered breathing in adults. Am J Epidemiol. 2013;177(9):1006–1014. doi: 10.1093/aje/kws342. [DOI] [PMC free article] [PubMed] [Google Scholar]
- 2.Jordan AS, McSharry DG, Malhotra A. Adult obstructive sleep apnoea. Lancet. 2014;383(9918):736–747. doi: 10.1016/S0140-6736(13)60734-5. [DOI] [PMC free article] [PubMed] [Google Scholar]
- 3.Neelapu BC, Kharbanda OP, Sardana HK, et al. Craniofacial and upper airway morphology in adult obstructive sleep apnea patients: a systematic review and meta-analysis of cephalometric studies. Sleep Med Rev. 2017;31:79–90. doi: 10.1016/j.smrv.2016.01.007. [DOI] [PubMed] [Google Scholar]
- 4.Schwab RJ, Pasirstein M, Pierson R, et al. Identification of upper airway anatomic risk factors for obstructive sleep apnea with volumetric magnetic resonance imaging. Am J Respir Crit Care Med. 2003;168(5):522–530. doi: 10.1164/rccm.200208-866OC. [DOI] [PubMed] [Google Scholar]
- 5.Watanabe T, Isono S, Tanaka A, Tanzawa H, Nishino T. Contribution of body habitus and craniofacial characteristics to segmental closing pressures of the passive pharynx in patients with sleep-disordered breathing. Am J Respir Crit Care Med. 2002;165(2):260–265. doi: 10.1164/ajrccm.165.2.2009032. [DOI] [PubMed] [Google Scholar]
- 6.Lee RWW, Sutherland K, Cistulli PA. Craniofacial morphology in obstructive sleep apnea: a review. Clin Pulm Med. 2010;17:189–195. [Google Scholar]
- 7.Hui DS, Ko FW, Chu AS, et al. Cephalometric assessment of craniofacial morphology in Chinese patients with obstructive sleep apnoea. Respir Med. 2003;97(6):640–646. doi: 10.1053/rmed.2003.1494. [DOI] [PubMed] [Google Scholar]
- 8.Lee RW, Chan AS, Grunstein RR, Cistulli PA. Craniofacial phenotyping in obstructive sleep apnea--a novel quantitative photographic approach. Sleep. 2009;32(1):37–45. [PMC free article] [PubMed] [Google Scholar]
- 9.Lee RW, Petocz P, Prvan T, Chan AS, Grunstein RR, Cistulli PA. Prediction of obstructive sleep apnea with craniofacial photographic analysis. Sleep. 2009;32(1):46–52. [PMC free article] [PubMed] [Google Scholar]
- 10.Lee RW, Sutherland K, Chan AS, et al. Relationship between surface facial dimensions and upper airway structures in obstructive sleep apnea. Sleep. 2010;33(9):1249–1254. doi: 10.1093/sleep/33.9.1249. [DOI] [PMC free article] [PubMed] [Google Scholar]
- 11.Sutherland K, Schwab RJ, Maislin G, et al. Facial phenotyping by quantitative photography reflects craniofacial morphology measured on magnetic resonance imaging in Icelandic sleep apnea patients. Sleep. 2014;37(5):959–968. doi: 10.5665/sleep.3670. [DOI] [PMC free article] [PubMed] [Google Scholar]
- 12.Sutherland K, Lee RW, Cistulli PA. Obesity and craniofacial structure as risk factors for obstructive sleep apnoea: impact of ethnicity. Respirology. 2012;17(2):213–222. doi: 10.1111/j.1440-1843.2011.02082.x. [DOI] [PubMed] [Google Scholar]
- 13.Sutherland K, Lee RW, Petocz P, et al. Craniofacial phenotyping for prediction of obstructive sleep apnoea in a Chinese population. Respirology. 2016;21(6):1118–1125. doi: 10.1111/resp.12792. [DOI] [PubMed] [Google Scholar]
- 14.Lee RW, Vasudavan S, Hui DS, et al. Differences in craniofacial structures and obesity in Caucasian and Chinese patients with obstructive sleep apnea. Sleep. 2010;33(8):1075–1080. doi: 10.1093/sleep/33.8.1075. [DOI] [PMC free article] [PubMed] [Google Scholar]
- 15.Redline S, Tishler PV, Hans MG, Tosteson TD, Strohl KP, Spry K. Racial differences in sleep-disordered breathing in African-Americans and Caucasians. Am J Respir Crit Care Med. 1997;155(1):186–192. doi: 10.1164/ajrccm.155.1.9001310. [DOI] [PubMed] [Google Scholar]
- 16.Coltman R, Taylor DR, Whyte K, Harkness M. Craniofacial form and obstructive sleep apnea in Polynesian and Caucasian men. Sleep. 2000;23(7):943–950. [PubMed] [Google Scholar]
- 17.Will MJ, Ester MS, Ramirez SG, Tiner BD, McAnear JT, Epstein L. Comparison of cephalometric analysis with ethnicity in obstructive sleep apnea syndrome. Sleep. 1995;18(10):873–875. doi: 10.1093/sleep/18.10.873. [DOI] [PubMed] [Google Scholar]
- 18.Tsai HH, Ho CY, Lee PL, Tan CT. Sex differences in anthropometric and cephalometric characteristics in the severity of obstructive sleep apnea syndrome. Am J Orthod Dentofacial Orthop. 2009;135(2):155–164. doi: 10.1016/j.ajodo.2008.10.001. [DOI] [PubMed] [Google Scholar]
- 19.Perri RA, Kairaitis K, Wheatley JR, Amis TC. Anthropometric and craniofacial sexual dimorphism in obstructive sleep apnea patients: is there male-female phenotypical convergence? J Sleep Res. 2015;24(1):82–91. doi: 10.1111/jsr.12205. [DOI] [PubMed] [Google Scholar]
- 20.Cakirer B, Hans MG, Graham G, Aylor J, Tishler PV, Redline S. The relationship between craniofacial morphology and obstructive sleep apnea in whites and in African-Americans. Am J Respir Crit Care Med. 2001;163(4):947–950. doi: 10.1164/ajrccm.163.4.2005136. [DOI] [PubMed] [Google Scholar]
- 21.Lam B, Ip MS, Tench E, Ryan CF. Craniofacial profile in Asian and white subjects with obstructive sleep apnoea. Thorax. 2005;60(6):504–510. doi: 10.1136/thx.2004.031591. [DOI] [PMC free article] [PubMed] [Google Scholar]
- 22.Schwab RJ, Leinwand SE, Bearn CB, et al. Digital morphometrics: a new upper airway phenotyping paradigm in OSA. Chest. 2017;152(2):330–342. doi: 10.1016/j.chest.2017.05.005. [DOI] [PMC free article] [PubMed] [Google Scholar]


