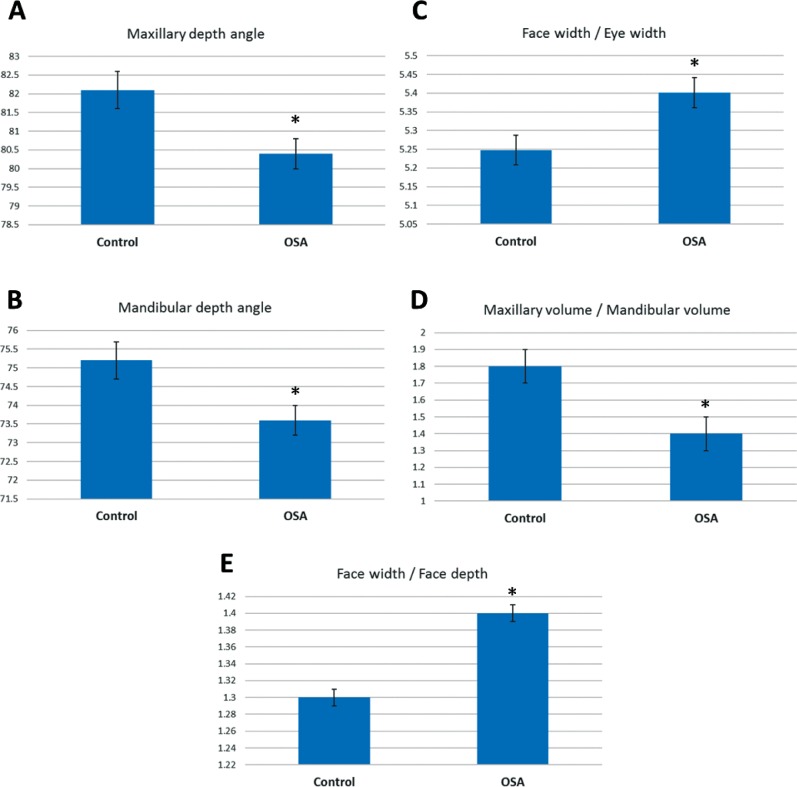
Figure 3. Craniofacial measurements in controls and subjects with OSA.
This figure illustrates differences for the main effect of OSA in the factorial analysis of variance (P < .05). The y axis represents the estimated marginal mean (mean value adjusted for other variables in the model, particularly height, body mass index, age, and neck circumference). There were five measurements that differed between controls and subjects with OSA, 2 craniofacial angles (A,B) and 3 craniofacial ratios (C,D,E). * = P < .05 controls versus subjects with OSA. OSA = obstructive sleep apnea.

