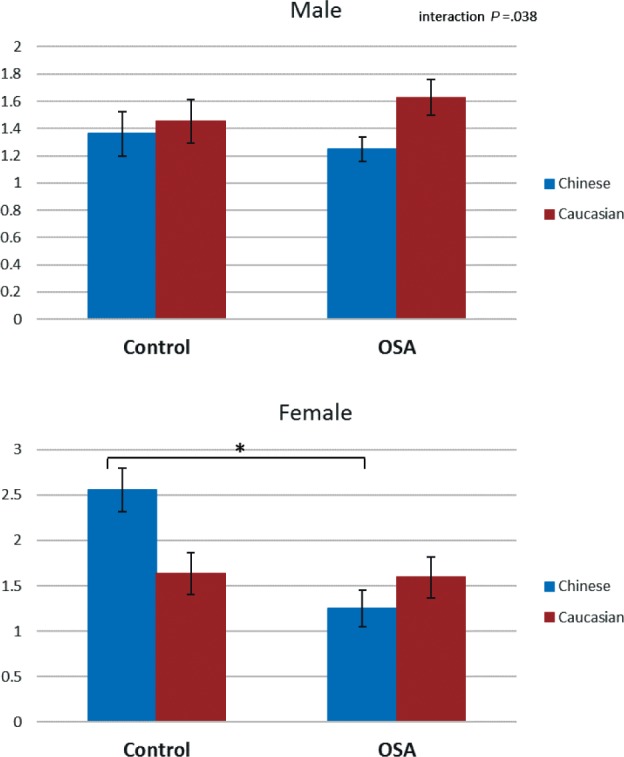
Figure 6. Three-way interaction of OSA status, ethnicity, and sex.

This figure illustrates the three-way interaction observed in the craniofacial ratio maxillary volume / mandibular volume in factorial analysis of variance (P < .05). The y axis represents the estimated marginal mean (mean value adjusted for other variables in the model, particularly height, body mass index, age, and neck circumference). Post hoc group comparisons * = P < .05 controls versus subjects with OSA. OSA = obstructive sleep apnea.
