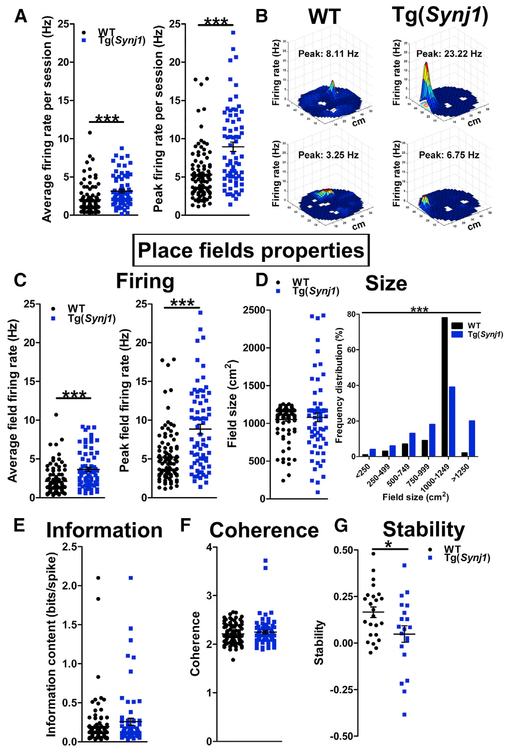
Figure 3. Overexpression of Synj1 Results in Hippocampal Hyperexcitability and Decreased Place Field Stability.
(A) Left: average firing rate of hippocampal excitatory (pyramidal) neurons in 24-month-old Tg(Synj1) mice (3.2 ± 0.2 Hz, n = 72 neurons from six animals) and controls (2.0 ± 0.2 Hz, n = 98 neurons from five animals). Right: peak firing rate of pyramidal neurons in Tg(Synj1) mice (9.3 ± 0.7 Hz) and controls (5.6 ± 0.4 Hz). ***p < 0.001 in Mann Whitney test.
(B) Representative examples of firing rate maps showing place fields obtained after WT and Tg(Synj1) mice explored a 50-cm-diameter cylindrical arena for 20 min. The firing rate is represented by a heatmap ranging from blue (no firing) to red (peak firing). White spaces indicate locations not visited by the animal.
(C) Left: average field firing rate in Tg(Synj1) mice (3.8 ± 0.3 Hz, n = 72 neurons) and controls (2.2 ± 0.2 Hz, n = 98 neurons). Right: peak field firing rate in Tg(Synj1) mice (9.2 ± 0.7 Hz) and controls (5.5 ± 0.4 Hz). ***p < 0.001 in Mann-Whitney test.
(D) Size of place fields in Tg(Synj1) and WT mice. The average size (left) of place fields was comparable (p > 0.05 in Mann-Whitney test) between Tg(Synj1) (1,066 ± 58 cm2, n = 72 neurons) and WT (1,043 ± 24 cm2, n = 98 neurons) mice, although the distribution (right) of place field sizes was significantly different (***p < 0.001 in chi-square test).
(E) Comparable (p > 0.05, Mann-Whitney test) information content between Tg(Synj1) (0.29 ± 0.05 bits/spike, n = 72) and WT (0.19 ± 0.03 bits/spike, n = 98) neurons.
(F) Similar spatial coherence (p > 0.05, Mann-Whitney test) between Tg(Synj1) (2.25 ± 0.03, n = 72) and WT (2.21 ± 0.02, n = 98) neurons.
(G) Place field stability at 18–24 hr was significantly decreased (*p < 0.05 in unpaired Student’s t test) in Tg(Synj1) mice (0.05 ± 0.04, n = 20 neurons) compared with controls (0.17 ± 0.03, n = 24 neurons).

