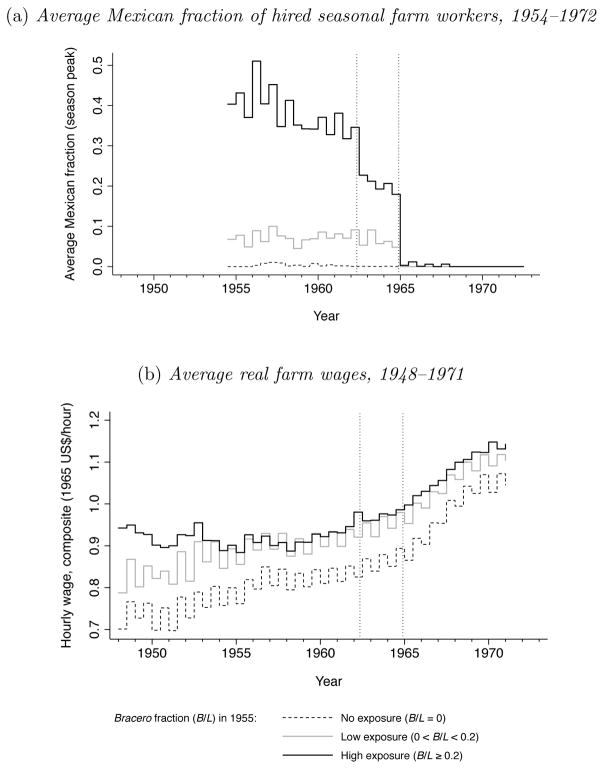
Figure 2.
Illustration of natural quasi-experiment and core result, states grouped by exposure
Note: Average across states, by season, of each outcome. Each year is split into two seasons: the first half of each year is the early season (February to July), the second half of each year is the late season (August to November). The outcomes are (a) peak Mexican fraction of hired seasonal farm workers during any month in the season, and (b) average real hourly wage in the two quarters that comprise that season. Real wage adjusted by national Consumer Price Index. Vertical dotted lines show the beginning of government efforts toward bracero exclusion (March 1962) and near-complete exclusion at the termination of the program (December 1964). High-exposure group is AZ, CA, NE, NM, SD, TX. Low-exposure group is AR, CO, GA, ID, IL, IN, MI, MN, MO, MT, NV, OR, TN, UT, WA, WI, WY. No-exposure group is AL, CT, DE, FL, IA, KS, KY, LA, MA, MD, ME, MS, NC, ND, NJ, NY, OH, OK, PA, SC, VA, VT, WV.

