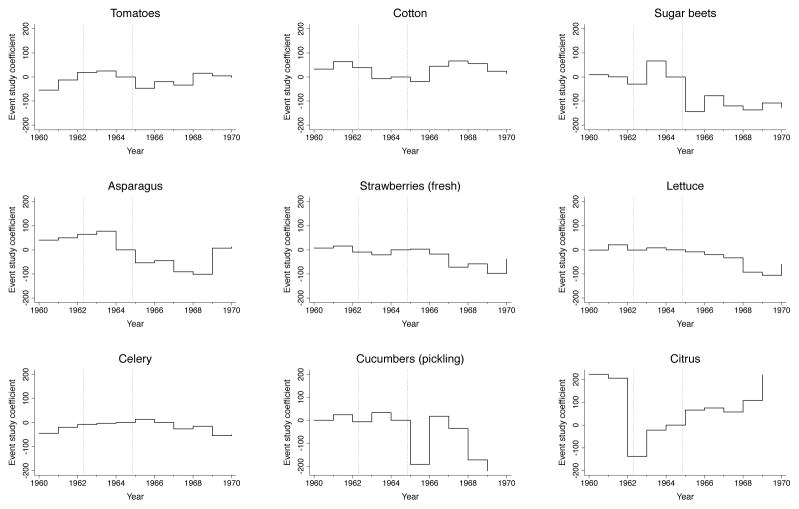
Figure 6.
Event study regression coefficients: crop physical production index
Note: Observations are state-years. Vertical axis shows event-study regression coefficients from equation (9). For each crop, dependent variable is a production index normalized so that each state’s physical production of the crop in 1964 ≡ 100. Vertical dotted lines show the beginning (March 1962) and completion (December 1964) of exclusion. Cucumbers, citrus truncated at ± 200 identical vertical ranges.

