
Fig. 3. Methylation at MEs, all-RRBS background, and SoC-associated loci, and potential genetic influences.
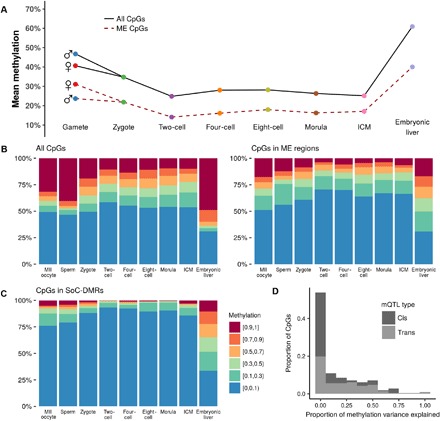
Within each developmental stage in all plots, CpGs are counted once for each replicate for which there was sufficient read depth. (A) Mean methylation at each developmental stage assayed by Guo et al. Solid line: mean methylation in all-RRBS background (n = 3,679,155 CpGs); dashed line: mean methylation at ME regions covered by RRBS (n = 302 regions; 2098 CpGs). (B) Distribution of methylation across developmental stages in all-RRBS background CpGs (left) and at CpGs within ME regions (right). See legend in (C). (C) Distribution of methylation at each stage in previously identified season of conception–associated differentially methylated regions (SoC-DMRs; see Materials and Methods). (D) Proportion of methylation variance explained by genetic variants in cis and in trans at ME-CpGs. These data are obtained from a previous comprehensive screen for methylation quantitative loci (mQTL)–CpGs in a large European study (23).