
Fig. 4. Methylation dynamics around the gastrulation transition.
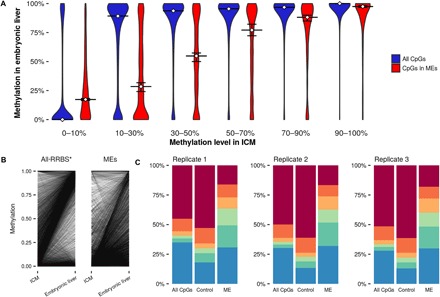
(A) Distribution of CpG methylation in embryonic liver, stratified by methylation level in ICM. Horizontal lines show the median methylation in embryonic liver. Error bars represent 95% bootstrapped confidence intervals. (B) Change in methylation at individual CpGs across the transition. Each line represents the change in methylation at a CpG for a single combination of replicates from each stage. *Because of the large number of data points, “all-RRBS” plot shows a random 0.1% sample of all possible ICM–embryonic liver transitions. (C) Distribution of methylation states in each embryonic liver replicate.