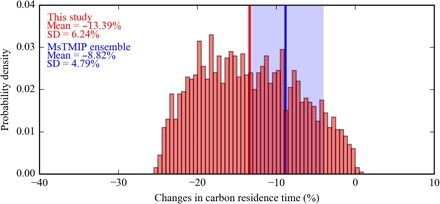
Fig. 2. Retrieved changes in carbon residence time based on the difference between 1979–1988 and 2004–2013 10-year periods.

The vertical red line indicates the average of retrieved changes in carbon residence time. The blue line indicates mean (solid line) and range (shading) in the equivalent residence time change estimates from the MsTMIP model ensemble.
