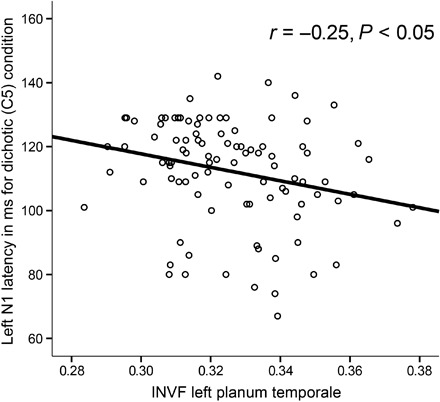
Fig. 3. Association between auditory speech processing and neurite architecture.

Scatter plot illustrating the relationship between INVF of the left PT and N1 latency of the left electrode (C5).

Scatter plot illustrating the relationship between INVF of the left PT and N1 latency of the left electrode (C5).