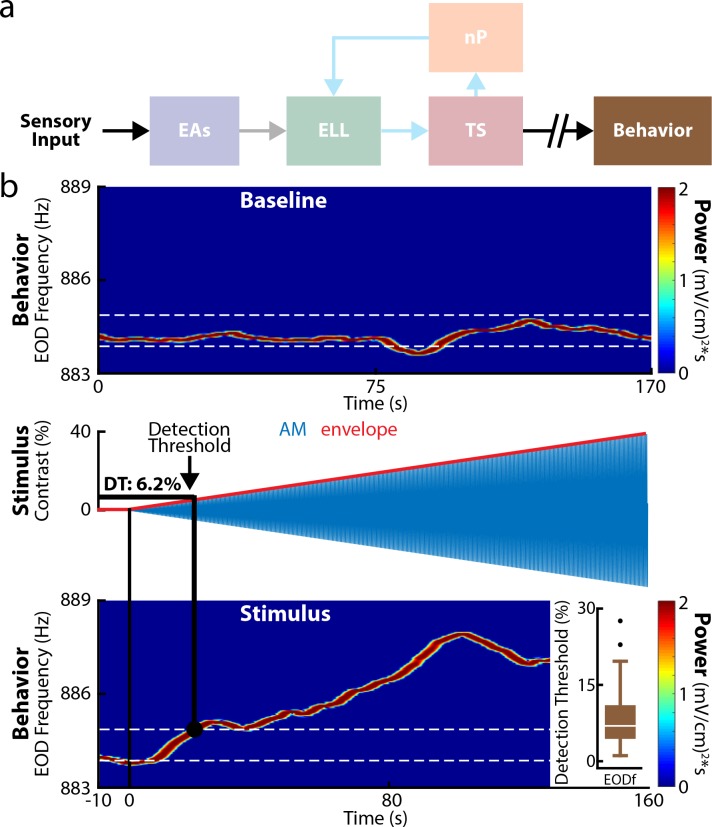
Fig 2. Weakly electric fish display low behavioral contrast detection thresholds.
(a) Relevant anatomy diagram showing the main brain areas considered. (b) Top: EOD spectrogram (i.e., time-varying power spectrum showing frequency as a function of time) obtained under baseline conditions (i.e., in the absence of stimulation but in the presence of the animal’s unmodulated EOD). We found that the frequency at which there is maximum power (i.e., the EOD frequency) fluctuated as a function of time, which was used to compute the range of values that contains 95% of the probability distribution (white dashed lines) to determine whether behavioral responses obtained under stimulation were significantly different from those obtained in the absence of stimulation. Middle: Stimulus waveform (blue) and its envelope (red) showing contrast as a function of time. Bottom: EOD spectrogram in response to the stimulus. It is seen that the EOD frequency (“EODf”) increases after stimulus onset. The detection threshold is the contrast corresponding to the earliest time after stimulus onset for which the EOD frequency was outside the range of values determined in the absence of stimulation (black circle and white dashed line). Inset: Population-averaged detection threshold values for behavior (n = 35, brown). The data can be downloaded at https://figshare.com/s/93707200732db87bb80f. EA, electroreceptor afferent; ELL, electrosensory lateral line lobe; EOD, electric organ discharge; nP, nucleus praeeminentialis; TS, torus semicircularis.

