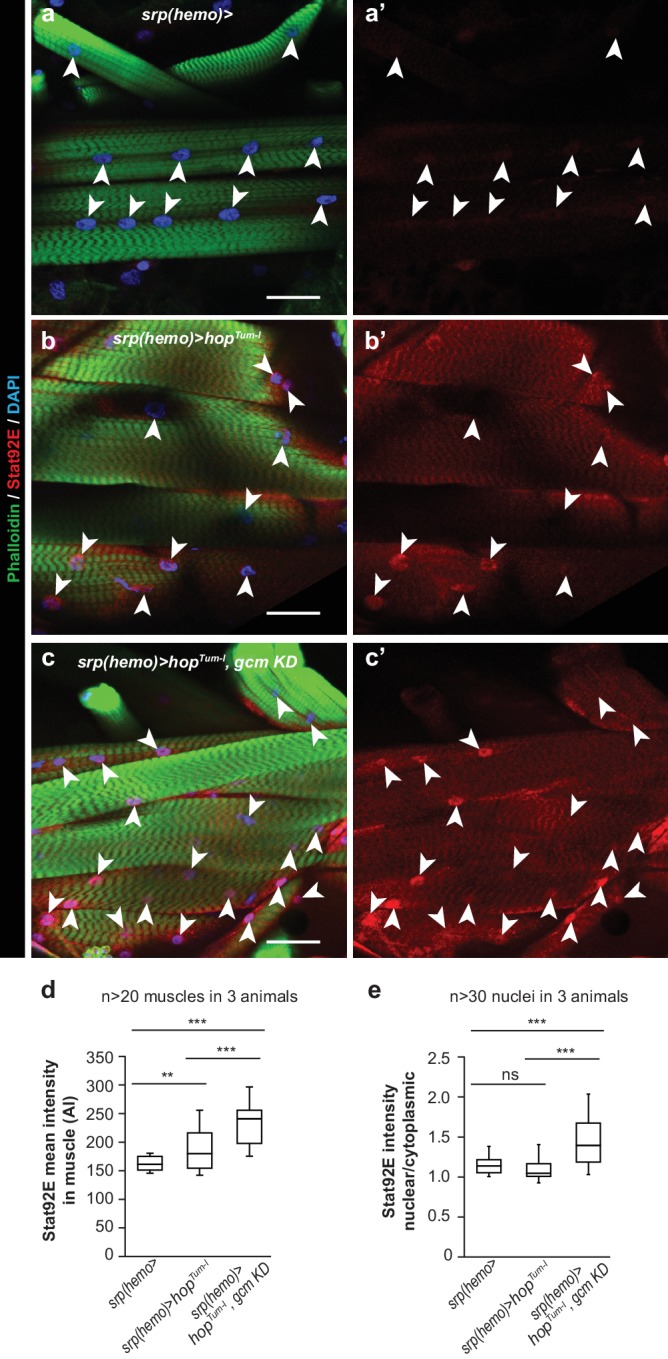
Figure 6. Jak/Stat activation in the embryonic hemocytes activates the Jak/Stat pathway in Wandering L3 muscles.

(a–c) Muscle immunolabelling in Wandering larvae of the indicated genotypes. The Phalloidin labelling (in green) highlights the striated muscle fibers rich in actin filament, Stat92E is in red and DAPI in blue. (a,b,c) show the merge of the three channels, (a’,b’,c’) show Stat92E alone. Scale bar: 50 µm. Arrowheads indicate nuclei in the muscles. (d,e) Box-plots representing the distribution of Stat92E intensity (d) and the ratio nuclear/cytoplasmic Stat92E (e) in Wandering L3 muscles of the indicated genotypes. Stat92E intensity was quantified in more than 20 muscles in three animals and the ratio nuclear/cytoplasmic Stat92E was measured in more than 30 nuclei in three animals for each genotype. From bottom to top, the boxes represent the 5% percentile, the first quartile, the median, the third quartile and the 95% percentile. P-values were measured using student test after variance analysis.
