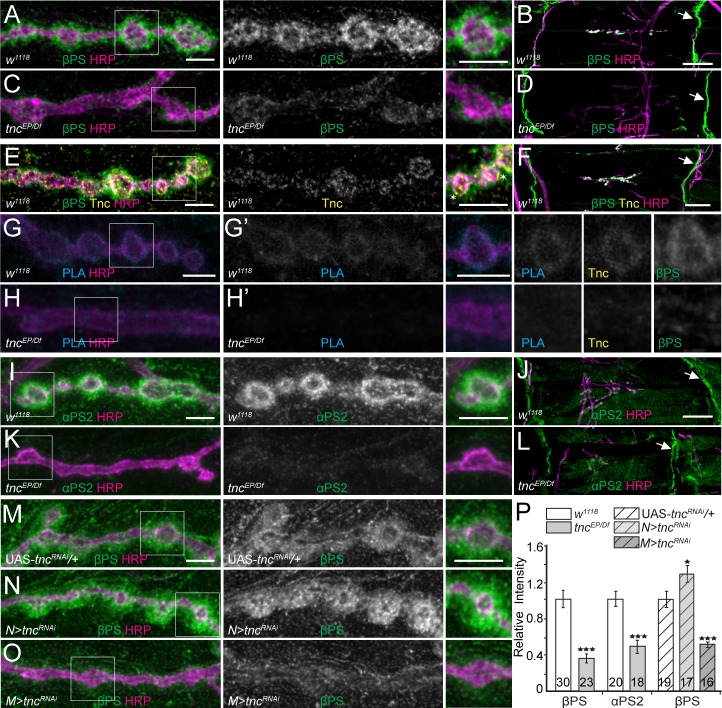
Figure 4. tnc mutants have reduced perisynaptic αPS2/βPS integrin.
(A–D) Confocal images of control NMJ4 boutons and NMJ 6/7 muscle fields of indicated genotypes stained for βPS (green) and HRP (magenta). Compared to control (w1118), tnc mutant have dramatically decreased βPS signals at the NMJs (quantified in P), but normal levels at the muscle attachment sites (arrows). (E–F) Confocal images of control NMJ4 boutons stained with Tnc (yellow), βPS (green) and HRP (magenta). Like βPS, Tnc concentrates at the periphery of HRP-marked boutons (asterisks), but unlike βPS, Tnc is not present at the muscle attachment sites. (G–H’) Distribution of Tnc (yellow), βPS (green), PLA signals (cyan) (G’–H’), and HRP (magenta) in control and tnc mutant boutons. PLA signals are only observed at control NMJs and localize circumferentially to the boutons, indicating that Tnc and βPS are in close proximity at the synaptic cleft. (I–P) Confocal images of NMJ4 boutons and NMJ6/7 muscle fields of indicated genotypes stained for αPS2 (I–L) or βPS (M–O) (green), and HRP (magenta). Similar to βPS, αPS2 signals are dramatically reduced at tnc mutant NMJs (quantified in P), but are normal at the muscle attachment sites (arrows). Tissue specific tnc knockdown indicates that postsynaptic Tnc controls the βPS accumulation at synaptic locations, whereas neuron-derived Tnc appears to limit it (M–O). The number of NMJs examined is indicated in each bar. Bars indicate mean ± SEM. ***p<0.001, *p<0.05. Scale bars: (A, E, G, G’, I and M) 5 μm; (B, F and J) 20 μm. Genotypes: tncEP/Df (tncEP/Df(3R)BSC655); N > tncRNAi (BG380-Gal4/+; UAS-tncRNAi/+); M > tncRNAi (UAS-tncRNAi/+; 24B-Gal4/+)..
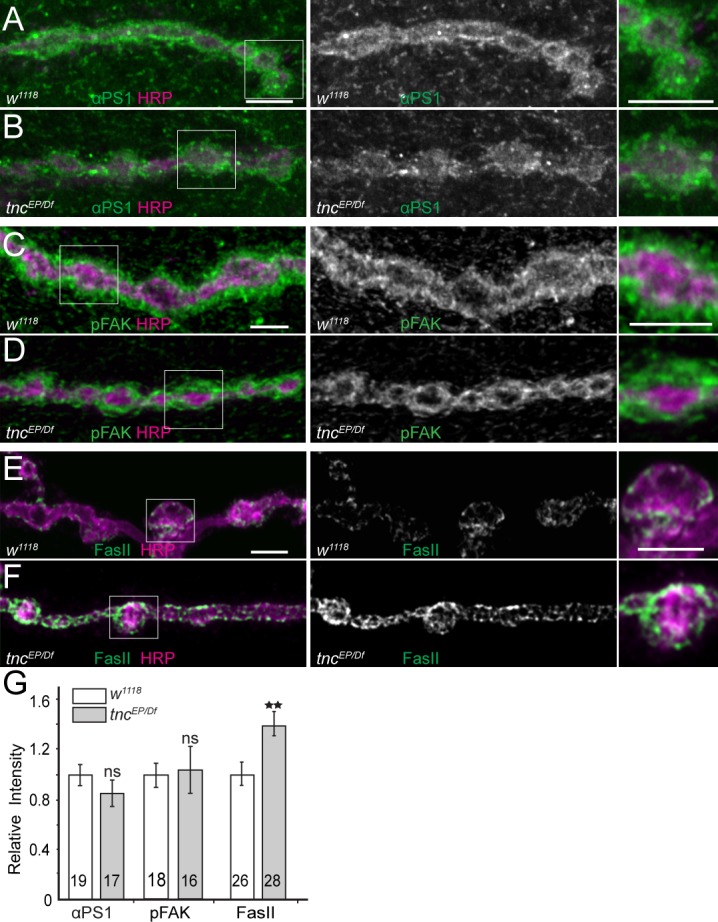
Figure 4—figure supplement 1. Comparison of various synaptic proteins in control and tnc mutant NMJs.


