. 2018 Jun 14;7:e35518. doi: 10.7554/eLife.35518

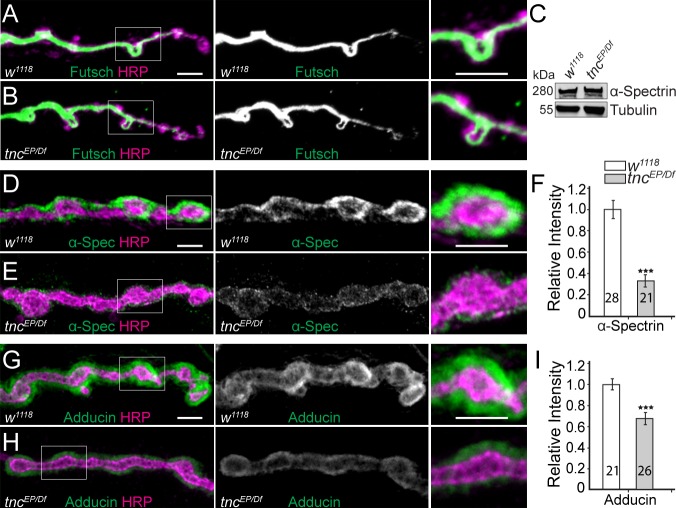
Figure 6. Diminished cortical skeleton at tnc mutant NMJs.

(A–B) Confocal images of NMJ4 boutons stained for Futsch (green) and HRP (magenta) reveal normal presynaptic Futsch-positive loops and microtubules bundles at tnc mutant NMJs. (C) Western blot analysis of lysates from larval carcasses show normal levels of α-Spectrin in tnc mutants. (D–I) Confocal images of NMJ4 boutons for the indicated genotypes stained for α-Spectrin (D–E), or Adducin (G–H) (green) and HRP (magenta), (quantified in F and I). α-Spectrin levels are dramatically decreased at tnc mutant NMJs; the reduction of Adducin is less drastic, but significant. The number of NMJs examined is indicated in each bar. Bars indicate mean ± SEM. ns (p>0.05), ***p<0.001. Scale bars: 5 μm.

Figure 6.

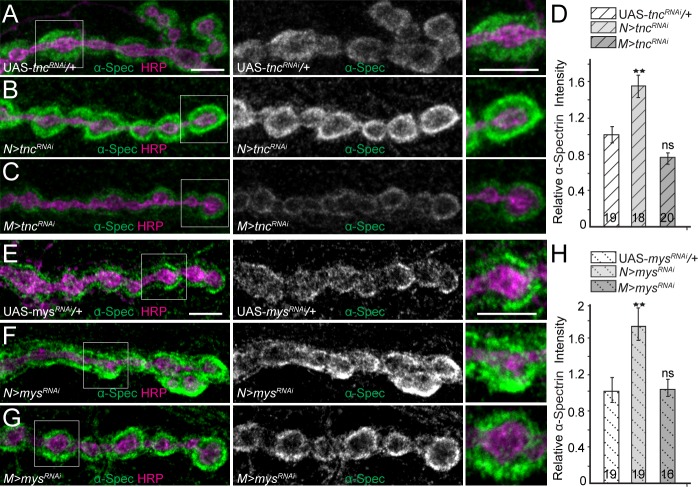
Figure 6—figure supplement 1. Tnc/integrin-mediated spectrin recruitment.

Figure 6—figure supplement 1.

(A–H) Confocal images of third instar NMJ4 boutons from control and various tnc and mys/βPS manipulations stained for α-Spectrin (green) and HRP (magenta). Neuronal knockdown of tnc significantly increases the α-Spectrin levels; muscle knockdown mildly decreases the α-Spectrin signals (quantified in D). Thus synaptic α-Spectrin generally follows the levels of synaptic Tnc (compare with Figure 4—figure supplement 2). The recruitment of α-Spectrin appears to be dependent on Tnc/integrin complexes, since muscle knockdown of mys/βPS drastically reduces α-Spectrin accumulation at synaptic terminals (quantified in H). The number of NMJs examined is indicated in each bar. Bars indicate mean ±SEM. ns (p>0.05), ***p<0.001, **p<0.01. Scale bars: 5 μm. Genotypes: N > tncRNAi (BG380-Gal4/+; UAS-tncRNAi/+); M > tncRNAi (UAS-tncRNAi/+; 24B-Gal4/+); N > mys RNAi (BG380-Gal4/+; UAS-mys RNAi/UAS-Dcr-2); M > mys RNAi (UAS-mys RNAi/UAS-Dcr-2; 24B-Gal4/+).