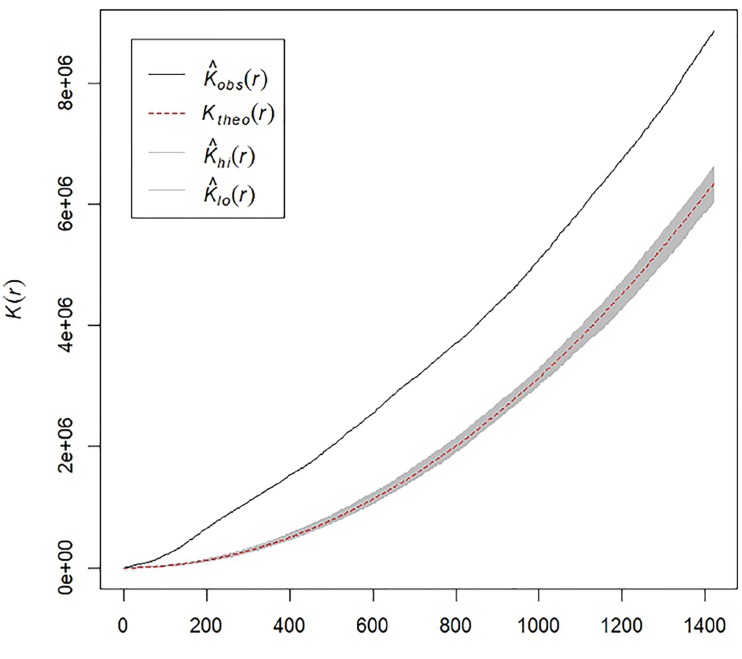
Figure 2.
Estimates of Ripley’s K-function (K) for opioid-related runs. Monte Carlo estimates (MCE) of observed vs. expected values of Ripley’s K-function as a function of distance (r). The solid black line shows the estimated observed K(r), while the dashed red line shows the theoretical K(r) in the setting of complete spatial randomness for the same number of observations. The gray-shaded area shows estimates of potential variability in K(r) assuming complete spatial randomness, generated by MCE with n=999 simulations.
Obs, observed; Theo, theoretical; Hi, Maximum MCE of theoretical distribution of K(r); Lo, minimum MCE of theoretical distribution of K(r).

