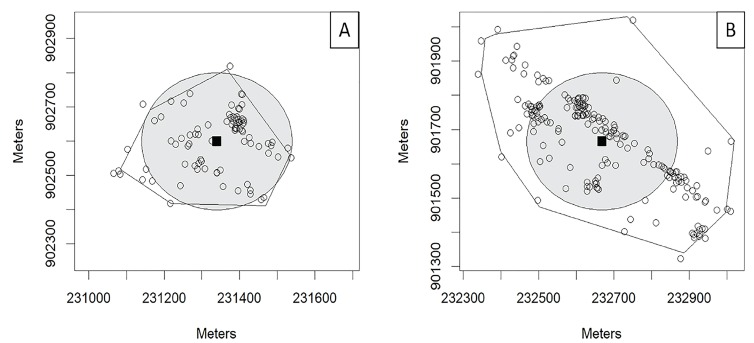
Figure 4.
Publicly deployed naloxone coverage areas in opioid-related emergency medical services (EMS) run clusters. Sub-maps of locations of opioid-related EMS runs in Cambridge, Massachusetts, centered on Cluster A (left) or Cluster B (right). Open circles represent locations in each cluster where at least one EMS run occurred during the study period. (A random spatial jitter has been applied to reduce numbers of degenerate points and better show approximate numbers of EMS runs at each location.) Locations of EMS calls that were not part of the relevant cluster are not shown. Solid lines surrounding clusters show the convex hull polygons describing the boundary of each cluster; because of the random spatial jitter, run locations may artificially appear outside of these polygons. Solid squares show the location of the centroid of each cluster, and shaded gray circles show circles with radii of 200 meters centered on cluster centroids.

