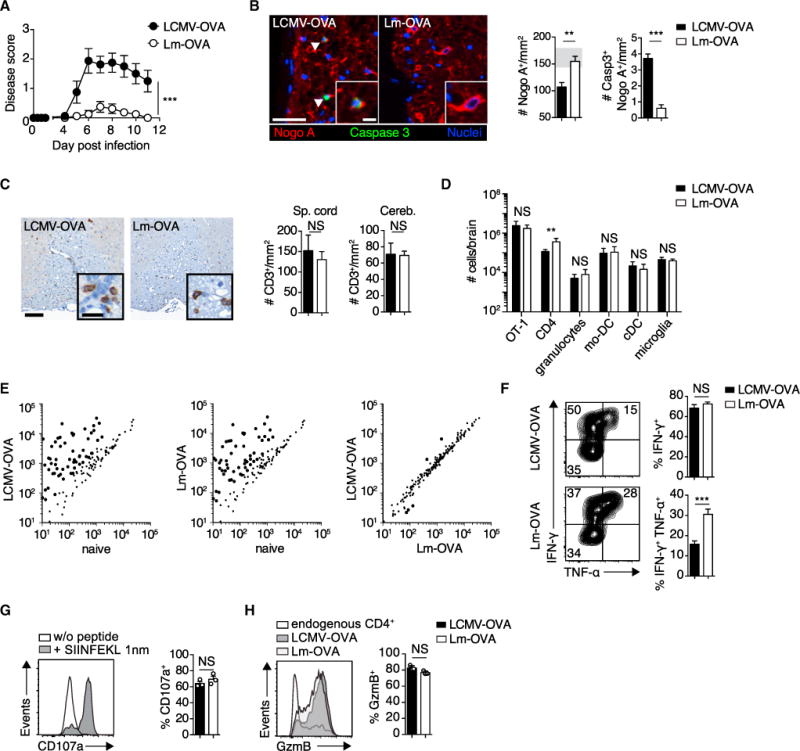
Figure 1. LCMV-OVA-but Not Lm-OVA-Primed OT-1 Cells Induce CD8+ T-Cell-Mediated CNS Disease in ODC-OVA Mice.

105 OT-1 cells were adoptively transferred into ODC-OVA mice. One day later (day 0), mice were challenged i.v. with either 105 PFU LCMV-OVA or 5 3 103 CFU Lm-OVA.
(A) EAE disease course (n = 8 mice per group).
(B) Representative images of spinal cord sections (day 7) co-immunostained for Nogo A (oligodendrocytes) and activated caspase-3 (arrows indicate a cell positive for both caspase-3 and Nogo A) and quantification thereof (n = 6 mice per group). Gray zone in the bar graph indicates the range (mean ± SEM) of naive ODC-OVA mice (n = 3).
(C) Representative spinal cord section (day 7) immunostained with anti-CD3. Bar graphs show quantification of T cell infiltrates in spinal cord (Sp. cord) and cerebellum (Cereb.) (n = 3 mice per group).
(D) Flow-cytometric enumeration of CNS-infiltrating cells and microglia (day 7; n = 6 mice).
(E) Nanostring expression profiling of inflammatory genes in the spinal cord of naive or pathogen-challenged (day 7) ODC-OVA mice.
(F) Intracellular staining of IFN-γ and TNF-α in splenic OT-1 cells (day 7) after in vitro stimulation with cognate peptide (SIINFEKL; n = 6 mice).
(G) Degranulation as measured by surface expression of CD107a on CNS-infiltrating OT-1 cells after in vitro stimulation with SIINFEKL peptide.
(H) Intracellular staining for GzmB in CNS-infiltrating OT-1 cells (day 7; n = 3 mice).
Scale bars, 100 μm (B and C) or 20 μm (insets in (B and C). NS, not significant; *p < 0.05; **p < 0.01; ***p < 0.001 (two-way ANOVA with Bonferroni’s post-test for A; unpaired t test for B, D, and F–H). Data represent the pool of at least two independent experiments in (A), (B), (D), and (F) or one out of two representative experiments in (C), (G), and (H). Bars represent mean ± SEM.
See also Figure S1.
