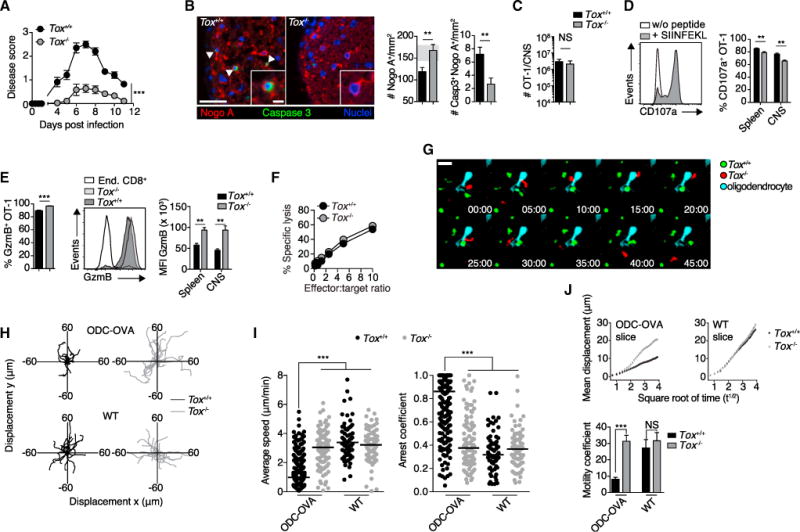
Figure 4. Tox-Deficient CTLs Are Less Encephalitogenic.

105 Tox+/+ or OT-1 Tox−/−cells were adoptively transferred into ODC-OVA mice. One day later (day 0), mice were challenged i.v. with 105 PFU LCMV-OVA.
(A) EAE disease course (n = 10 mice per group).
(B) Representative images of spinal cord section (day 7) co-immunostained for Nogo A (oligodendrocytes) and activated caspase-3 (arrows indicate a cell positive for both caspase-3 and Nogo A) and quantification thereof (n = 8 mice per group). Gray zone in the bar graph indicates the range (mean ± SEM) of naive ODC-OVA mice (n = 3 mice).
(C) Flow-cytometric enumeration of CNS-infiltrating OT-1 cells (day 7, n = 6 mice).
(D) Degranulation as measured by CD107a surface expression on isolated splenic and CNS-infiltrating OT-1 cells after in vitro stimulation with SIINFEKL peptide.
(E) Flow-cytometric enumeration of GzmB-expressing OT-1 cells isolated from the CNS (left graph). GzmB expression in splenic and CNS-infiltrating OT-1 cells is as indicated in (A) (day 7, n = 6 mice, right graph). MFI, mean fluorescence intensity.
(F) Cytolytic activity of CNS-infiltrating Tox+/+ and Tox−/−OT-1 cells (day 7) measured in co-culture with SIINFEKL-pulsed EL-4 target cells.
(G) Representative time-lapse imaging of CNS-isolated Tox+/+ (green) and Tox−/−(red) OT-1 cells co-incubated onto organotypic hippocampal slice cultures of ODC-OVA mice. Oligodendrocytes were transduced with eGFP-expressing Adeno-associated vector under the control of myelin basic promotor (AAV-MBP-eGFP; see also STAR Methods and Video S1); bottom right corners indicate time (min:s).
(H) Superimposed 15 min individual tracks (lines) in the xy plane of 20 randomly selected OT-1 cells (starting coordinate set as 0). Data are pooled from two independent experiments.
(I) Average speed (μm/min) and arrest coefficient of Tox+/+ and Tox−/−OT-1 individual cells incubated onto WT or ODC-OVA slices. Horizontal lines indicate the median.
(J) Mean displacement of Tox+/+ and Tox−/−OT-1 cells in WT and ODC-OVA slices is plotted against the square root of time (min1/2). Motility coefficient was calculated as M = D2/4t, where M is the motility coefficient, D is displacement, and t is time.
Scale bars represent 100 μm (B) or 20 μm (G and inset in B). NS, not significant; **p < 0.01; ***p < 0.001 (two-way ANOVA with Bonferroni’s post-test for A, unpaired t test for B–E, one-way ANOVA with Tukey’s post-test for I, and Kruskal-Wallis ANOVA for J). Data represent the pool of at least two independent experiments in (A)–(E), (I), and (J) or one out of two representative experiments in (F). Bars represent mean ± SEM. See also Figure S4 and Videos S1 and S2.
