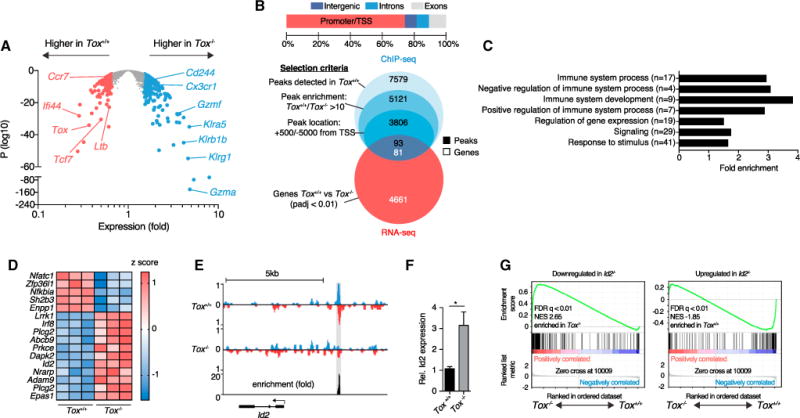
Figure 5. TOX Represses Expression Signature of Terminal Differentiation in CTLs.

105 Tox+/+ or Tox−/−OT-1 cells were adoptively transferred into ODC-OVA mice. One day later (day 0), mice were challenged i.v. with 105 PFU LCMV-OVA. CNS-infiltrating OT-1 cells were sorted 7 days later for (A) RNA-seq gene expression, (B–E) ChIP-seq analysis of TOX binding site, or (F) qRT-PCR.
(A) Volcano plot comparing differential gene expression in Tox+/+ versus Tox−/−OT-1 cells (n = 3 mice per group).
(B) Distribution of the 5,121 peaks between promoters (from −5,000 bp to +500 bp from transcription starting sites [TSSs]), introns, exons, and intergenic regions. Venn diagrams show the selection of ChIP-seq peaks and their overlap with RNA-seq data.
(C) Selected GO terms enrichment of selected peaks identified in (B); numbers in brackets represent total number of genes in that specific GO term.
(D) Heatmap showing relative expression of a selection of genes belonging to immunological processes and identified in (B); each column represents an individual mouse.
(E) ChIP-seq analysis of TOX binding in the Id2 upstream region. We determined fold enrichment of TOX binding by dividing the number of reads in Tox+/+ OT-1 cells by the number of reads in Tox−/−OT-1 cells at the Id2 binding site. Detected peak is highlighted in gray.
(F) Relative expression of Id2 (Gapdh used for normalization) measured by qRT-PCR in Tox+/+ and Tox−/−OT-1 cells (n = 5 mice per group).
(G) Gene-set enrichment analysis of Id2-dependent gene sets in the gene expression profile (RNA-seq analysis as in A shows genes with lower expression in Id2−/−[left] or higher expression in Id2+/+ [right] CTLs; Masson et al., 2013). FDR, false-discovery rate; NES, normalized enrichment score.
*p < 0.05 (unpaired t test in F). Bars represent mean ± SEM. See also Figure S5.
