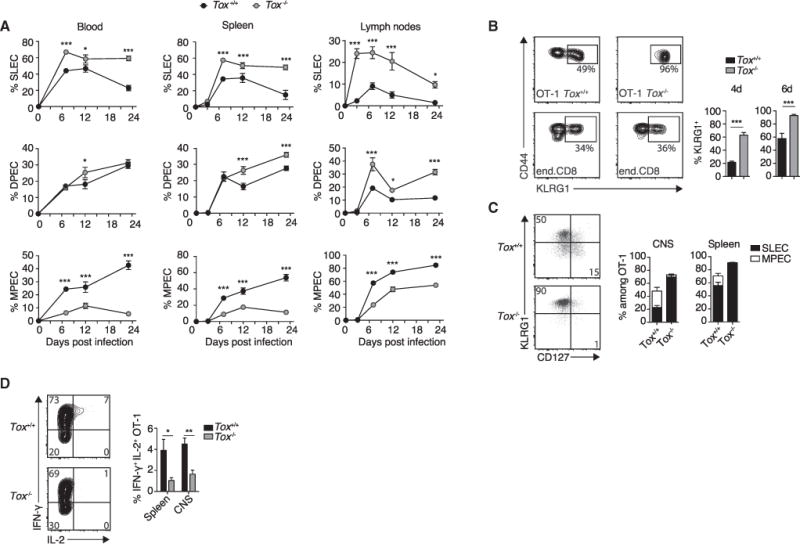
Figure 6. TOX Reduces the Generation of Terminally Differentiated CTLs.

105 Tox+/+ or Tox−/−OT-1 cells were adoptively transferred into WT (A) or ODC-OVA (B–D) mice. One day later (day 0), mice were challenged i.v. with 105 PFU LCMV-OVA.
(A) Time-course analysis of clonal differentiation of OT-1 cells into SLECs (KLRG1hi CD127lo), DPECs (KLRG1hi CD127hi), and MPECs (KLRG1lo CD127hi) in the blood, spleen, and lymph nodes.
(B) Representative flow-cytometry plot showing surface expression of CD44 and KLRG1 on OT-1 cells or endogenous pool of CD8+ T cells in the blood (day 6). Numbers in the plot indicate the percentage of KLRG1hi cells among effector Tox+/+ or Tox−/−OT-1 cells (CD44+, CD45.1+) or endogenous effector CD8+ T cells (CD44+, CD45.2+). Bar graphs show quantification thereof at the indicated time points (n = 6 mice per group).
(C) Representative flow-cytometry plot and quantification of the frequency of SLECs and MPECs in Tox+/+ and Tox−/−OT-1 cells isolated from the spleen and the CNS (day 6; n = 6 mice per group).
(D) Intracellular staining for IFN-γ and IL-2 in CNS-infiltrating Tox+/+ and Tox−/−OT-1 cells after in vitro stimulation with SIINFEKL peptide (day 6; n = 6 mice per group).
*p < 0.05; **p < 0.01; ***p < 0.001 (two-way ANOVA with Sidak’s post-test for A and unpaired t test for B and D). Data are representative of at least two independent experiments (B–D). Bars represent mean ± SEM. See also Figure S6.
