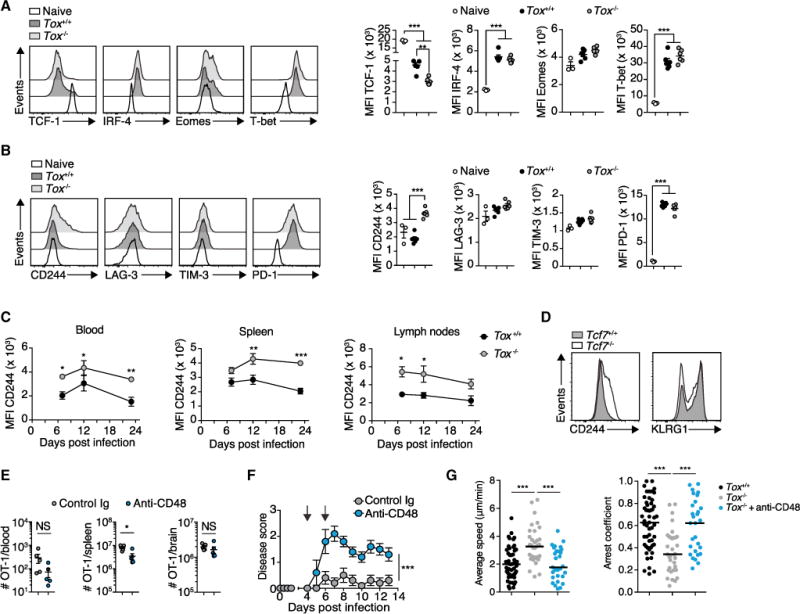
Figure 7. Inhibitory Receptor CD244 Is Induced on Tox-Deficient Effector CTLs and Blockade of CD244-CD48 Signaling Restores Their Encephalitogenic Properties.

(A and B) 105 Tox+/+ or Tox−/−OT-1 cells were adoptively transferred into ODC-OVA mice. One day later (day 0), mice were challenged i.v. with 105 PFU LCMV-OVA. CNS-infiltrating OT-1 cells were isolated at day 6. (A) Representative histograms and quantification of TCF-1, IRF-4, Eomes, and T-bet expression. (B) Representative histograms and quantification of surface expression of CD244, LAG-3, TIM-3, and PD-1 (n = 6 mice per group; naive splenic OT-1 cells served as control; n = 3 mice).
(C) 105 Tox+/+ or Tox−/−OT-1 cells were adoptively transferred into WT mice. One day later (day 0), mice were challenged i.v. with 105 PFU LCMV-OVA. Time-course analysis of CD244 expression in OT-1 cells from the blood, spleen, and lymph nodes. MFI, mean fluorescence intensity.
(D) Flow-cytometric analysis of surface expression of CD244 and KLRG1 on adoptively transferred Tcf7+/+ and Tcf7−/−P14 cells in the blood 7 days after LCMV-Arm infection of the WT recipient.(E and F) Mice received Tox−/−OT-1 cells and were challenged with LCMV-OVA as in (A). Anti-CD48-neutralizing antibody (HM48-1) or its respective isotype control antibody was administered i.p. (300 μg) 4 and 6 days after infection (n = 5 mice per group). (E) Flow-cytometric enumeration of Tox−/−OT-1 cells in the blood, spleen, and brain (day 7; n = 6 mice per group). (F) EAE disease course.
(G) Average speed (μm/min) and arrest coefficient of Tox+/+ and Tox−/−OT-1 cells that were treated with and without anti-CD48 and incubated onto ODC-OVA slices. Horizontal lines indicate the median.
NS, not significant; *p < 0.05; **p < 0.01; ***p < 0.001 (unpaired t test for F, two-way ANOVA with Bonferroni’s post-test for E, and one-way ANOVA with Tukey’s post-test for A, B, and G). Data represent one out of at least two independent experiments (A–G). Bars represent mean ± SEM. See also Figure S7.
