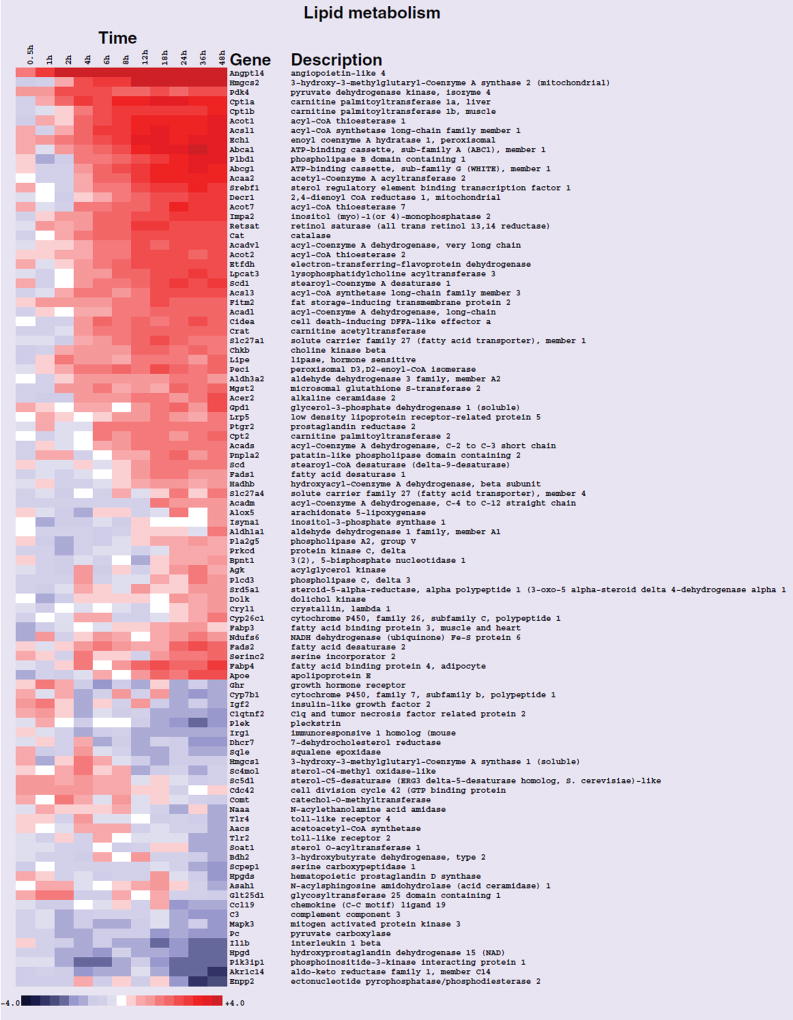
Figure 1. Heat map of gene-expression changes in neonatal rat ventricular myocytes in response to rosiglitazone involving transcripts that play a role in lipid metabolism.
Red and blue colored boxes depict relative over- and under-expression in rosiglitazone treated with respect to control DMSO treated neonatal rat ventricular myocytes. The range of colors is between −4-fold and +4-fold and preserves qualitative relationships among individual values. All fold changes outside of this range have been truncated to ±4. Genes found significant at the level q < 0.05 in the entire time course comparison are shown.

