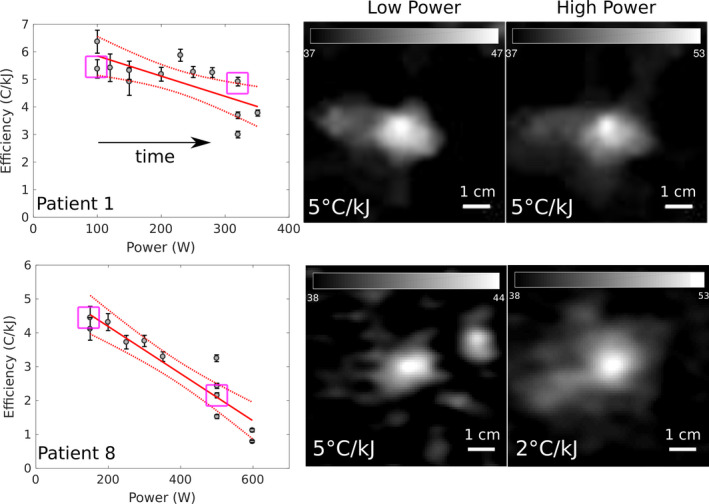
Figure 4.

The clinical sequences of sonications as functions of power, with sonication order indicated by the arrow directions. Patients 1 and 8 are presented. There is no significant reduction in efficiency over time for Patient 1 (P = 0.06), while there is a significant reduction in efficiency for Patient 8 (P < 0.01). A comparison of clinical cases of low reduction in energy–temperature efficiency (top row, Patient 1) and high reduction in efficiency (bottom row, Patient 8). Axial MR thermometry images are presented for both cases, with low‐ and high‐power sonications examined. The squares in the power efficiency plots indicate the highlighted cases in the thermometry images. In Patient 1, there is minimal change in the efficiency between low and high powers. In Patient 8, there is a 60% (0.06–0.02/0.06) decrease in the efficiency between 150 and 600 W. [Color figure can be viewed at wileyonlinelibrary.com]
