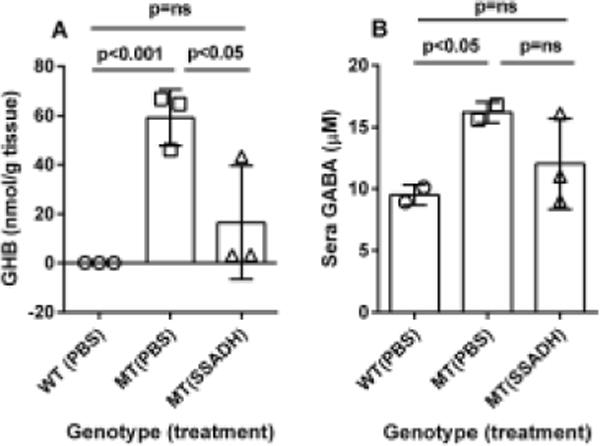
Fig. 4. Metabolic measures in animals treated with ERT.

The treatment scheme is described in the legend to Fig. 3. (A) Brain GHB content as a function of genotype (WT=wild-type, aldh5a1+/+ mice; MT=mutant, aldh5a1−/− mice; PBS, phosphate-buffered saline; SSADH, recombinant SSADH. (B) GABA in sera. Data depicted as mean + SD. Statistical analyses employed one-way ANOVA with post-hoc analysis (t test).
