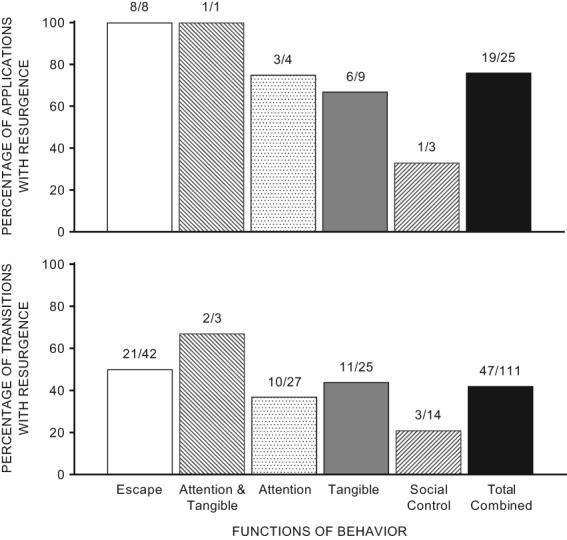
Figure 1.

Prevalence of resurgence across applications of schedule thinning (top panel) and within dense‐to‐lean transitions throughout schedule thinning (bottom panel) organized by function of destructive behavior. Applications with resurgence (represented as numerator of fraction) and total applications for a given column (represented as denominator of fraction) highlight the varying number of applications within each function.
