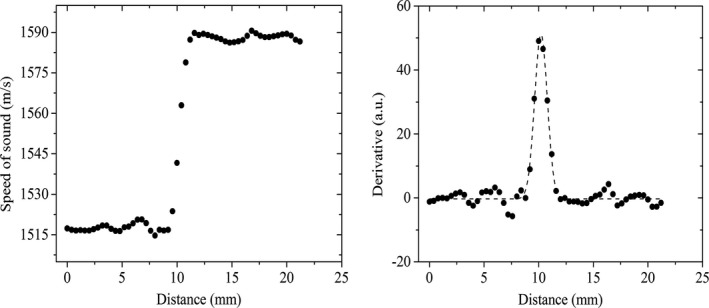
Figure 6.

(Left) Data points from an example line profile across the urethane‐agar interface. The line profile represents the edge‐spread function across the interface; (Right) First derivative of the edge‐spread function with the corresponding Gaussian function fit (dashed line). The Gaussian fit represents the point spread function and the respective FWHM is the resolution.
