
. 2018 Jul 11;10:31. doi: 10.1186/s13321-018-0286-7
© The Author(s) 2018
Open AccessThis article is distributed under the terms of the Creative Commons Attribution 4.0 International License (http://creativecommons.org/licenses/by/4.0/), which permits unrestricted use, distribution, and reproduction in any medium, provided you give appropriate credit to the original author(s) and the source, provide a link to the Creative Commons license, and indicate if changes were made. The Creative Commons Public Domain Dedication waiver (http://creativecommons.org/publicdomain/zero/1.0/) applies to the data made available in this article, unless otherwise stated.
Fig. 2.
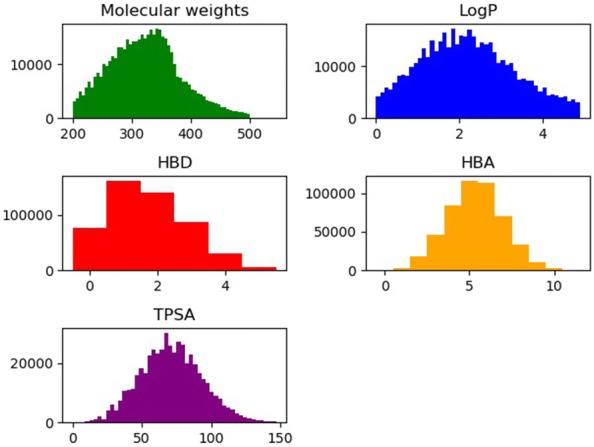
Distribution of molecular weight, LogP, HBD, HBA, and TPSA in the total dataset (500,000)