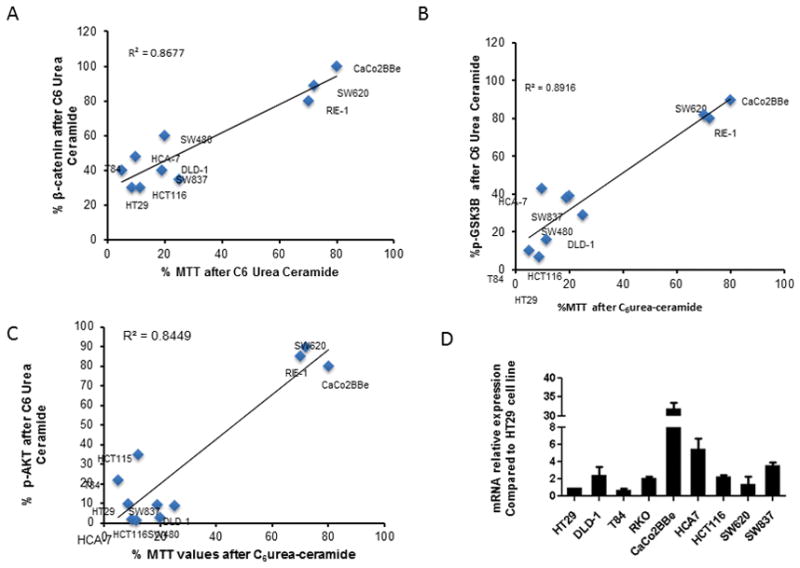
Figure 5. Decrease of cell growth of CRC cells is strongly associated with effects on β-catenin, GSK3β, and AKT phosphorylation.

Ten different colon and rectal cancer cell lines were treated with or without 10 μM of C6 urea-ceramide and the effects on MTT were measured. Experiments were performed in triplicate. Treated and control cells were also evaluated for β-catenin levels, as well as total AKT, phosphorylation of AKT on serine 473, total GSK3β and phosphorylation of GSK3β on serine 9.
A: The graph shows for each cell line the percentage of total level of β-catenin after C6 urea-ceramide treatment as a function of the percentage of MTT after C6 urea-ceramide.
B: The graph shows for each cell line the percentage of GSK3β phosphorylation after C6 urea-ceramide treatment as a function of the percentage of MTT after C6 urea-ceramide.
C: Graph shows for each cell line the percentage of AKT phosphorylation after C6 urea-ceramide treatment as a function of the percentage of MTT after C6 urea-ceramide.
D: Graph bars show for each cell line relative mRNA expression of nCDase compared to HT29.
