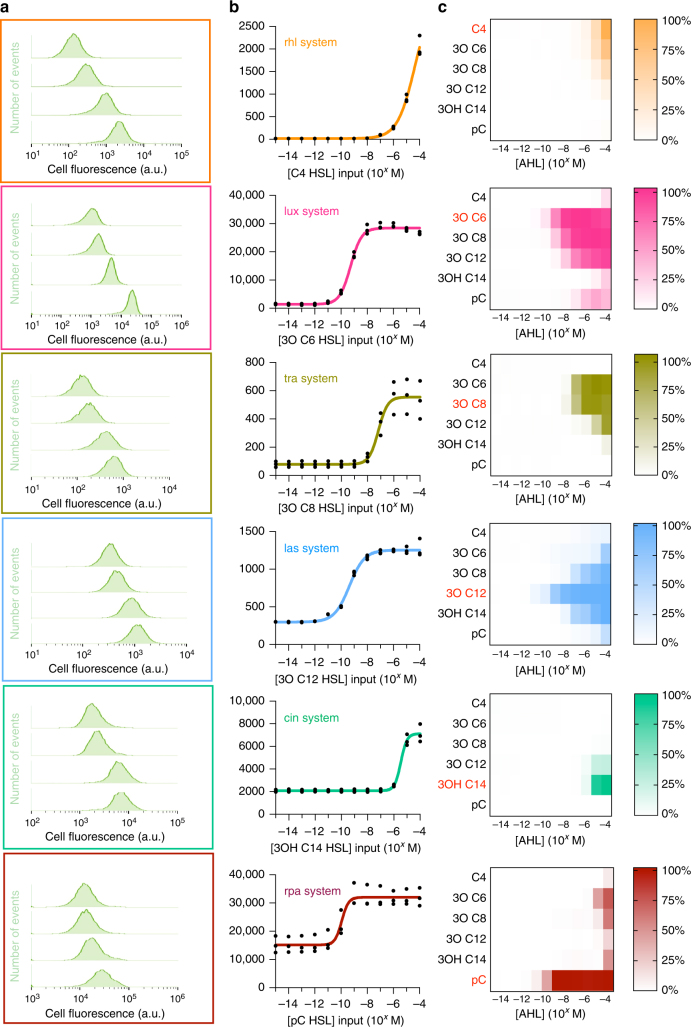
Fig. 2.
Characterisation of AHL-receiver devices. a Histograms of cell fluorescence from flow cytometry data of AHL-receiver composite devices/AHL inducers cognate pairs at selected inducer concentrations. b Input–output functions of AHL-receiver devices, i.e. GFP output in arbitrary units (au) against cognate AHL inducer concentrations derived when mean fluorescence data were fitted with a four-parameter logistical function model (Eq. 1). Points represent individual data for three biological replicates and coloured lines represent the fitted logistical model. c Heat maps of GFP output from AHL-receiver composite devices induced with cognate (coloured red) and non-cognate AHL inducer concentrations. The GFP output was normalised against the maximal expression of the cognate system. Coloured frames and plots correspond to AHL-receiver devices as follows (from top to bottom): rhl system (orange), lux system (pink), tra system (yellow-green), las system (light blue), cin system (green) and rpa system (red)

