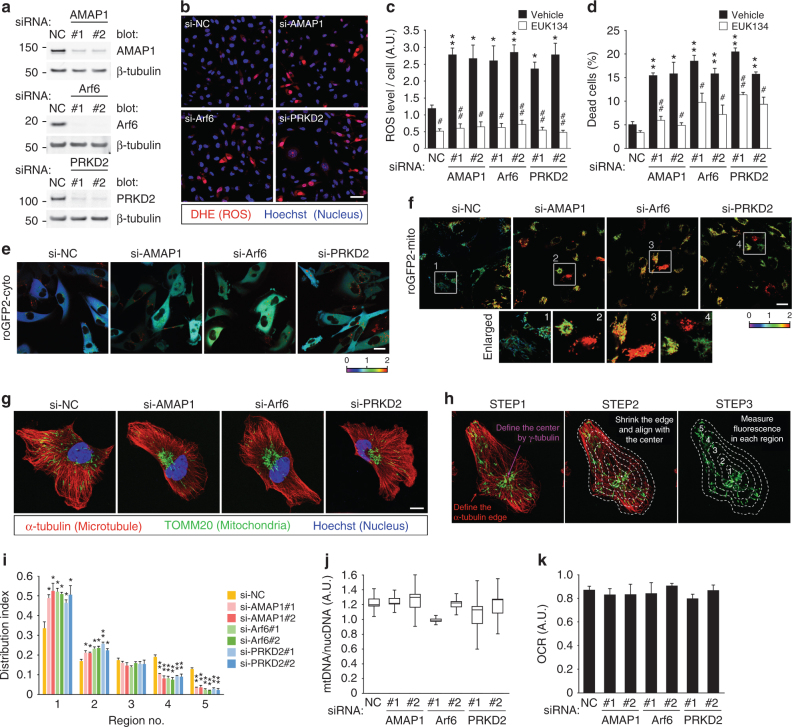
Fig. 1.
The Invasive machinery based on the Arf6–AMAP1 pathway regulates mitochondrial distribution and ROS levels. MDA-MB-231 cells were transfected with siRNAs (si-) targeting AMAP1, Arf6, or PRKD2, or the non-silencing control (NC) RNA duplex, as indicated. a Western blot of AMAP1, Arf6, or PRKD2. β-tubulin was used as a loading control (also for experiments hereafter). b ROS production was visualized by DHE (red). Nucleus staining with Hoechst 33342 (blue) is also shown. Bar, 50 μm. c, d Quantification of DHE fluorescence (c) and cumulative cell death (d) after siRNA transfection, in the presence or absence of 100 μM EUK-134. e, f Subcellular redox state analyzed by roGFP2 localized to the cytoplasm (cyto, e) or mitochondria (mito, f). The numbered white squares in (f) indicate the enlarged areas shown beneath. The fluorescence ratio of 405–488 nm excitation is shown by a heatmap. Bar, 20 μm. g Immunostaining of TOMM20 (green) and α-tubulin (red) by specific antibodies. The nucleus was stained with Hoechst 33342 (blue). Bar, 10 μm. h Scheme of the quantification of mitochondrial distribution. i Mitochondrial distribution indices quantified as described in Methods. j Ratio of mitochondrial to nuclear DNA copy numbers, measured as a function of mitochondrial biosynthesis. The graph is a box-and-whisker plot showing the first quartile, median, and third quartile, and the lower and upper error bars indicate the 1.5× interquartile range, respectively. k Relative oxygen consumption rate. All the graphs except for (j) indicate the mean ± standard error of the mean (SEM) for three independent experiments. * and #P < 0.05; ** and ##P < 0.005 (two-tailed t-test, adjusted by the Holm–Sidak method). * and **, comparison to si-NC samples; # and ##, comparison to the corresponding vehicle-treated samples

