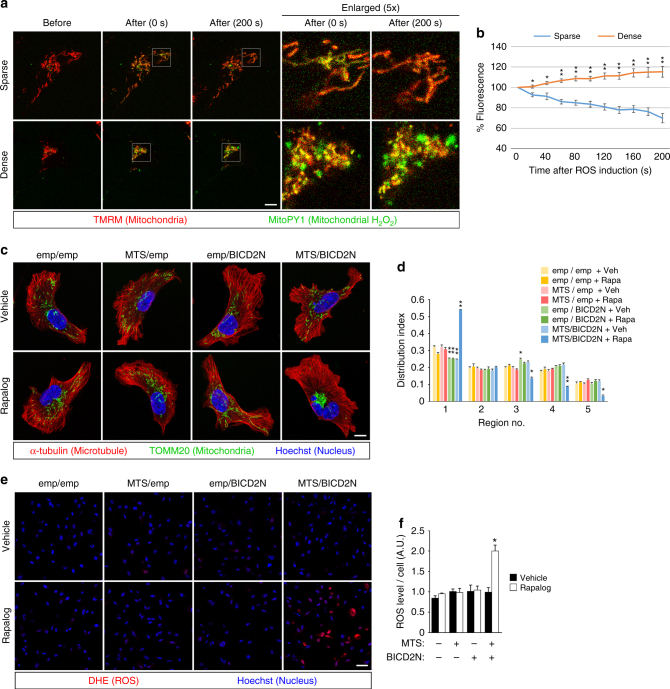
Fig. 2.
ROS Amplification by dense mitochondria within a single breast cancer cell. a Visualization of mitochondrial H2O2 in MDA-MB-231 cells. Mitochondria were labeled with TMRM (red), and H2O2 was visualized using MitoPY1 (green). Time-lapse images of the cells with sparse or dense mitochondria, before and after ROS induction by photoexcitation of TMRM, are shown. The white squares indicate the enlarged areas shown on the right. To avoid fluorescence saturation, the laser power for the excitation of TMRM (to visualize mitochondria) was reduced by several fold in dense condition. Bar, 10 μm. b Quantification of the time-dependent changes of MitoPY1 fluorescence in cells with dense or sparse mitochondrial networks. c–f MDA-MB-231 cells were stably transfected with FKBP-MTS (MTS) and/or BICD2N-FRB* (BICD2N), and treated with either vehicle or AP21967 (Rapalog). The empty vector (emp) was also used as a control. c, d Mitochondrial distribution was visualized by immunostaining (c), and quantified (d) as above. Bar, 10 μm. e, f ROS production was visualized by DHE (e), and quantified (f) as above. Bar, 50 μm. All graphs indicate the mean ± SEM for 10 (b) or three (d, f) independent experiments. * and ** indicate P < 0.05 and P < 0.005 (two-tailed t-test, adjusted by the Holm–Sidak method), compared to the corresponding samples (sparse vs. dense in b, emp/emp vs. others in d and f), respectively

