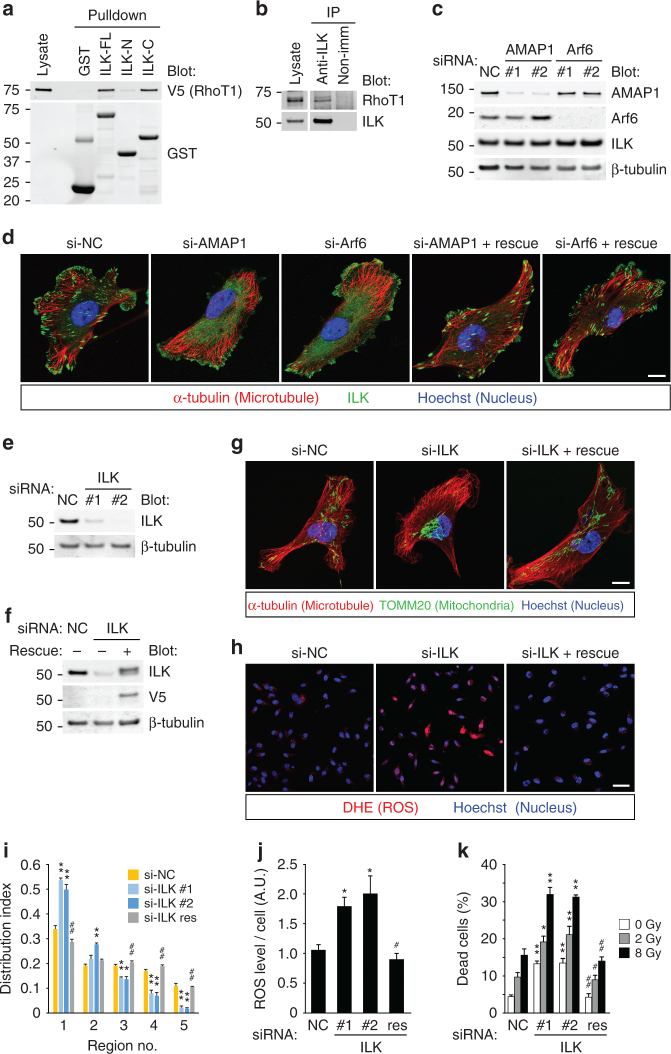
Fig. 4.
Localization of ILK at FAs is essential for regulation of mitochondrial distribution. a GST-pulldown assay using lysates from 293T cells overexpressing V5-tagged RhoT1 and the full length (ILK-FL), N terminus (ILK-N) or C terminus (ILK-C) of ILK fused to GST. GST alone (GST) was also used as a control. b Immunoprecipitation using MDA-MB-231 cell lysates and the anti-ILK antibody. Nonimmune rabbit IgG (non-imm) was also used as a control. c, d MDA-MB-231 cells were transfected with siRNAs targeting AMAP1 or Arf6. Protein expression of AMAP1, Arf6, or ILK was analyzed by western blot (c). ILK (green), microtubules (red), and nuclei (blue) were fluorescently visualized by specific antibodies or dyes. Bar, 10 μm (d). e–k MDA-MB-231 cells, either parental or stably transfected with ILK cDNA refractory to siRNA, were transfected with siRNAs targeting ILK. Protein expression of ILK was analyzed by western blot (e, f). Mitochondria (green), microtubules (red), and nuclei (blue) were fluorescently visualized by specific antibodies or dyes. Bar, 10 μm (g). Mitochondrial distribution indices were quantified (i). ROS production was visualized by DHE (h), and quantified (j). Bar, 50 μm. Cells were exposed to the indicated doses of IR, and cumulative cell death was measured (k). All graphs indicate the mean ± SEM for three independent experiments. * and ** indicate P < 0.05 and P < 0.005 (two-tailed t-test, adjusted by the Holm–Sidak method), compared to the corresponding samples (si-NC vs. si-ILK #1 or #2), respectively

