Fig. 7.
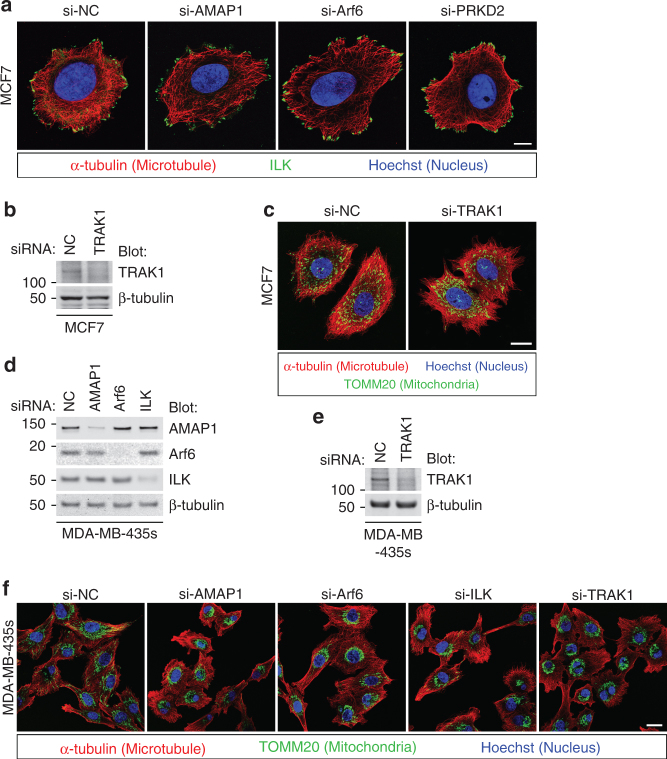
Utilization of the ILK–RhoT–TRAK axis for regulation of mitochondrial distribution in highly invasive breast cancer cells. a–c MCF7 cells were transfected with siRNAs targeting AMAP1, Arf6, PRKD2, or TRAK1. ILK (green), microtubules (red), and nuclei (blue) were fluorescently visualized by specific antibodies or dyes. Bar, 10 μm (a). Protein expression of TRAK1 was analyzed by western blotting (b). Mitochondria (green), microtubules (red), and nuclei (blue) were fluorescently visualized by specific antibodies or dyes. Bar, 20 μm (c). d–f MDA-MB-435s cells were transfected with siRNAs targeting AMAP1, Arf6, ILK, or TRAK1. Protein expression of AMAP1, Arf6, and ILK was analyzed by western blotting (d). TRAK1 expression was also examined separately (e). Mitochondria (green), microtubules (red), and nuclei (blue) were fluorescently visualized by specific antibodies or dyes. Bar, 20 μm (f)

