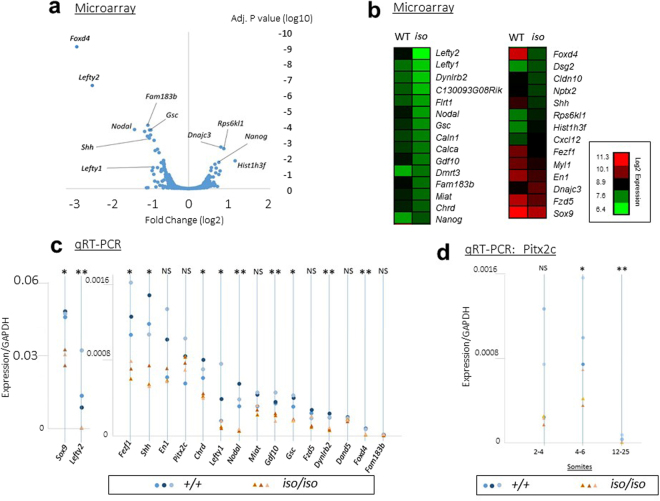
Figure 3.
Loss of Zic2 leads to downregulation of the NODAL pathway. (a,b) Microarray analysis of gene expression changes in the Zic2iso/iso embryo compared to wildtype at E8.5. (a) Volcano plot. The data are plotted as log fold change (relative to wildtype) against adjusted p-value. (b) Heat map showing wildtype (WT; left panel) and Zic2iso/iso (KO; right panel) embryos. Data show mean expression for three independent biological replicates of pooled embryos and are expressed as log2 values. (c) SYBR Green based qRT-PCR analysis of genes identified in the microarray screen, and known NODAL pathway genes. Expression values shown are normalised to Gapdh. Three independent biological replicates of pooled embryos (0–4 somites) were performed for each condition and these are plotted as individual data points (blue circles indicate wildtype; orange triangles indicate Zic2iso/iso). Asterisks above each column indicate result of a one tailed t-test of samples with unequal variance testing the null hypothesis that loss of Zic2 has no effect on gene expression: ***p < 0.0005; **p < 0.005; *p < 0.05, NS = not significant. (d) Taqman qRT-PCR analysis of Pitx2c expression at three different ages (2–4 somites, 4–6 somites and 12–25 somites). Three independent biological replicates of pooled embryos were performed for each condition. Labels as per panel c.

